General Plan Update - City of Inglewood
General Plan Update - City of Inglewood
General Plan Update - City of Inglewood

Create successful ePaper yourself
Turn your PDF publications into a flip-book with our unique Google optimized e-Paper software.
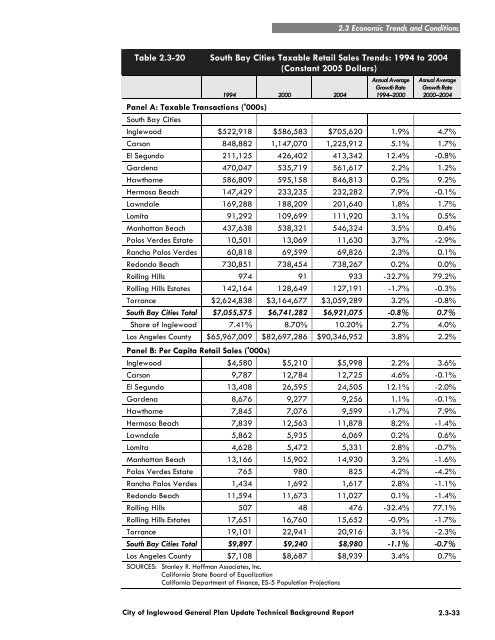
2.3 Economic Trends and Conditions<br />
Table 2.3-20 South Bay Cities Taxable Retail Sales Trends: 1994 to 2004<br />
(Constant 2005 Dollars)<br />
1994 2000 2004<br />
Annual Average<br />
Growth Rate<br />
1994–2000<br />
Annual Average<br />
Growth Rate<br />
2000–2004<br />
Panel A: Taxable Transactions ('000s)<br />
South Bay Cities<br />
<strong>Inglewood</strong> $522,918 $586,583 $705,620 1.9% 4.7%<br />
Carson 848,882 1,147,070 1,225,912 5.1% 1.7%<br />
El Segundo 211,125 426,402 413,342 12.4% -0.8%<br />
Gardena 470,047 535,719 561,617 2.2% 1.2%<br />
Hawthorne 586,809 595,158 846,813 0.2% 9.2%<br />
Hermosa Beach 147,429 233,235 232,282 7.9% -0.1%<br />
Lawndale 169,288 188,209 201,640 1.8% 1.7%<br />
Lomita 91,292 109,699 111,920 3.1% 0.5%<br />
Manhattan Beach 437,638 538,321 546,324 3.5% 0.4%<br />
Palos Verdes Estate 10,501 13,069 11,630 3.7% -2.9%<br />
Rancho Palos Verdes 60,818 69,599 69,826 2.3% 0.1%<br />
Redondo Beach 730,851 738,454 738,267 0.2% 0.0%<br />
Rolling Hills 974 91 933 -32.7% 79.2%<br />
Rolling Hills Estates 142,164 128,649 127,191 -1.7% -0.3%<br />
Torrance $2,624,838 $3,164,677 $3,059,289 3.2% -0.8%<br />
South Bay Cities Total $7,055,575 $6,741,282 $6,921,075 -0.8% 0.7%<br />
Share <strong>of</strong> <strong>Inglewood</strong> 7.41% 8.70% 10.20% 2.7% 4.0%<br />
Los Angeles County $65,967,009 $82,697,286 $90,346,952 3.8% 2.2%<br />
Panel B: Per Capita Retail Sales ('000s)<br />
<strong>Inglewood</strong> $4,580 $5,210 $5,998 2.2% 3.6%<br />
Carson 9,787 12,784 12,725 4.6% -0.1%<br />
El Segundo 13,408 26,595 24,505 12.1% -2.0%<br />
Gardena 8,676 9,277 9,256 1.1% -0.1%<br />
Hawthorne 7,845 7,076 9,599 -1.7% 7.9%<br />
Hermosa Beach 7,839 12,563 11,878 8.2% -1.4%<br />
Lawndale 5,862 5,935 6,069 0.2% 0.6%<br />
Lomita 4,628 5,472 5,331 2.8% -0.7%<br />
Manhattan Beach 13,166 15,902 14,930 3.2% -1.6%<br />
Palos Verdes Estate 765 980 825 4.2% -4.2%<br />
Rancho Palos Verdes 1,434 1,692 1,617 2.8% -1.1%<br />
Redondo Beach 11,594 11,673 11,027 0.1% -1.4%<br />
Rolling Hills 507 48 476 -32.4% 77.1%<br />
Rolling Hills Estates 17,651 16,760 15,652 -0.9% -1.7%<br />
Torrance 19,101 22,941 20,916 3.1% -2.3%<br />
South Bay Cities Total $9,897 $9,240 $8,980 -1.1% -0.7%<br />
Los Angeles County $7,108 $8,687 $8,939 3.4% 0.7%<br />
SOURCES: Stanley R. H<strong>of</strong>fman Associates, Inc.<br />
California State Board <strong>of</strong> Equalization<br />
California Department <strong>of</strong> Finance, ES-5 Population Projections<br />
<strong>City</strong> <strong>of</strong> <strong>Inglewood</strong> <strong>General</strong> <strong>Plan</strong> <strong>Update</strong> Technical Background Report<br />
2.3-33