Spices and Herbs
Spices and Herbs
Spices and Herbs

Create successful ePaper yourself
Turn your PDF publications into a flip-book with our unique Google optimized e-Paper software.
4 THE EUROPEAN UNION MARKET<br />
4.1 The European Union market summary<br />
4.1.1 Consumption<br />
Since 1 January 1995 the EU consists of 15 member states <strong>and</strong> in 1997 the size of the EU<br />
market totalled 373 million consumers with an average GDP per capita of ECU 18,100 in<br />
1996. In 1997 the total world production of spices <strong>and</strong> herbs was 4.5 million tonnes, of<br />
which 95 per cent was produced in developing countries <strong>and</strong> of which the greater part is<br />
consumed in the domestic markets of these producing countries.<br />
All the developed countries (EU, North America, Far East, Eastern Europe <strong>and</strong> Northern<br />
Africa) jointly imported a total of 774,365 tonnes of spices <strong>and</strong> herbs in 1997. This is an<br />
increase of 62 per cent compared to 478,168 tonnes in 1992. After the USA, the EU is the<br />
second largest world market for spices <strong>and</strong> herbs. In 1997 the total EU import volume of<br />
260,831 tonnes represented 28 per cent of the total imports of spices <strong>and</strong> herbs by<br />
developed countries.<br />
In 1997 the EU apparent consumption (imports minus exports) was estimated to be 158,660<br />
tonnes with a value of ECU 324 million. Gross imports fluctuate quite considerably around<br />
this figure due to the differing stock levels held by major trading companies at any one time<br />
<strong>and</strong> to the (re-) export trade between member countries of the EU.<br />
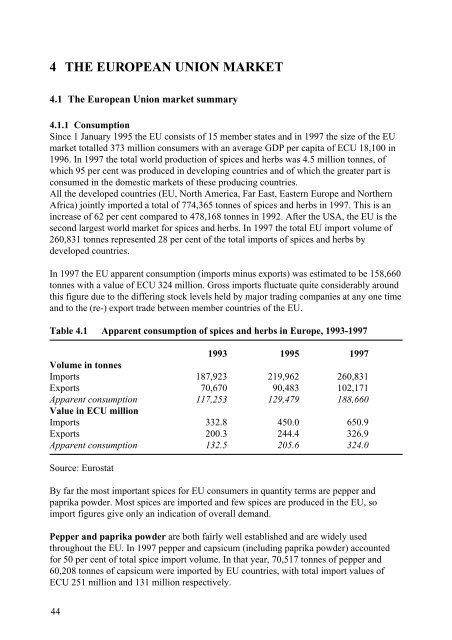
Table 4.1 Apparent consumption of spices <strong>and</strong> herbs in Europe, 1993-1997<br />
1993 1995 1997<br />
Volume in tonnes<br />
Imports 187,923 219,962 260,831<br />
Exports 70,670 90,483 102,171<br />
Apparent consumption 117,253 129,479 188,660<br />
Value in ECU million<br />
Imports 332.8 450.0 650.9<br />
Exports 200.3 244.4 326.9<br />
Apparent consumption 132.5 205.6 324.0<br />
Source: Eurostat<br />
By far the most important spices for EU consumers in quantity terms are pepper <strong>and</strong><br />
paprika powder. Most spices are imported <strong>and</strong> few spices are produced in the EU, so<br />
import figures give only an indication of overall dem<strong>and</strong>.<br />
Pepper <strong>and</strong> paprika powder are both fairly well established <strong>and</strong> are widely used<br />
throughout the EU. In 1997 pepper <strong>and</strong> capsicum (including paprika powder) accounted<br />
for 50 per cent of total spice import volume. In that year, 70,517 tonnes of pepper <strong>and</strong><br />
60,208 tonnes of capsicum were imported by EU countries, with total import values of<br />
ECU 251 million <strong>and</strong> 131 million respectively.<br />
44