Socio-Economic Report - Department of Agriculture and ...
Socio-Economic Report - Department of Agriculture and ...
Socio-Economic Report - Department of Agriculture and ...

You also want an ePaper? Increase the reach of your titles
YUMPU automatically turns print PDFs into web optimized ePapers that Google loves.
UDM ENVIRONMENTAL MANAGEMENT FRAMEWORK<br />
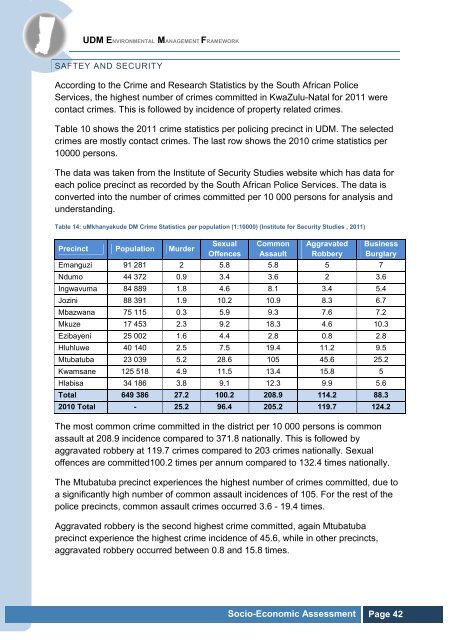
SAFTEY AND SECURITY<br />
According to the Crime <strong>and</strong> Research Statistics by the South African Police<br />
Services, the highest number <strong>of</strong> crimes committed in KwaZulu-Natal for 2011 were<br />
contact crimes. This is followed by incidence <strong>of</strong> property related crimes.<br />
Table 10 shows the 2011 crime statistics per policing precinct in UDM. The selected<br />
crimes are mostly contact crimes. The last row shows the 2010 crime statistics per<br />
10000 persons.<br />
The data was taken from the Institute <strong>of</strong> Security Studies website which has data for<br />
each police precinct as recorded by the South African Police Services. The data is<br />
converted into the number <strong>of</strong> crimes committed per 10 000 persons for analysis <strong>and</strong><br />
underst<strong>and</strong>ing.<br />
Table 14: uMkhanyakude DM Crime Statistics per population (1:10000) (Institute for Security Studies , 2011)<br />
Precinct Population Murder<br />
Sexual<br />
Offences<br />
Common<br />
Assault<br />
Aggravated<br />
Robbery<br />
Business<br />
Burglary<br />
Emanguzi 91 281 2 5.8 5.8 5 7<br />
Ndumo 44 372 0.9 3.4 3.6 2 3.6<br />
Ingwavuma 84 889 1.8 4.6 8.1 3.4 5.4<br />
Jozini 88 391 1.9 10.2 10.9 8.3 6.7<br />
Mbazwana 75 115 0.3 5.9 9.3 7.6 7.2<br />
Mkuze 17 453 2.3 9.2 18.3 4.6 10.3<br />
Ezibayeni 25 002 1.6 4.4 2.8 0.8 2.8<br />
Hluhluwe 40 140 2.5 7.5 19.4 11.2 9.5<br />
Mtubatuba 23 039 5.2 28.6 105 45.6 25.2<br />
Kwamsane 125 518 4.9 11.5 13.4 15.8 5<br />
Hlabisa 34 186 3.8 9.1 12.3 9.9 5.6<br />
Total 649 386 27.2 100.2 208.9 114.2 88.3<br />
2010 Total - 25.2 96.4 205.2 119.7 124.2<br />
The most common crime committed in the district per 10 000 persons is common<br />
assault at 208.9 incidence compared to 371.8 nationally. This is followed by<br />
aggravated robbery at 119.7 crimes compared to 203 crimes nationally. Sexual<br />
<strong>of</strong>fences are committed100.2 times per annum compared to 132.4 times nationally.<br />
The Mtubatuba precinct experiences the highest number <strong>of</strong> crimes committed, due to<br />
a significantly high number <strong>of</strong> common assault incidences <strong>of</strong> 105. For the rest <strong>of</strong> the<br />
police precincts, common assault crimes occurred 3.6 - 19.4 times.<br />
Aggravated robbery is the second highest crime committed, again Mtubatuba<br />
precinct experience the highest crime incidence <strong>of</strong> 45.6, while in other precincts,<br />
aggravated robbery occurred between 0.8 <strong>and</strong> 15.8 times.<br />
<strong>Socio</strong>-<strong>Economic</strong> Assessment Page 42