Socio-Economic Report - Department of Agriculture and ...
Socio-Economic Report - Department of Agriculture and ...
Socio-Economic Report - Department of Agriculture and ...

Create successful ePaper yourself
Turn your PDF publications into a flip-book with our unique Google optimized e-Paper software.
UDM ENVIRONMENTAL MANAGEMENT FRAMEWORK<br />
force participation rate is a measure the percentage <strong>of</strong> the working age population<br />
that are active participants – either seeking work or employed.<br />
Hlabisa LM KZ274 has the highest unemployment rate in the area <strong>of</strong> 35.3 percent<br />
followed by Jozini KZ 272 at 30.2 percent. The lowest unemployment rate is in<br />
Mtubatuba KZ 275at 10.44 percent.<br />
Umhlabuyalingana KZ271 has the lowest labour force participation rate as only<br />
21.72 percent <strong>of</strong> the total labour force is active. Mtubatuba KZ275 has a 64.85 labour<br />
force participation rate.<br />
In comparison to the rest <strong>of</strong> the local municipalities, Mtubatuba is<br />
Table 16: Unemployment Rate <strong>and</strong> Labour Participation Rate 2010 (Quantec Research (Pty) Ltd, 2012)<br />
Rate UDM KZ 271 KZ 272 KZ 273 KZ 274 KZ 275 KZDMA<br />
Unemployment rate 26.62 30.22 30.94 19.75 35.30 10.44 20.48<br />
Labour force<br />
participation rate 28.24 21.72 23.72 38.48 24.79 64.86 48.85<br />
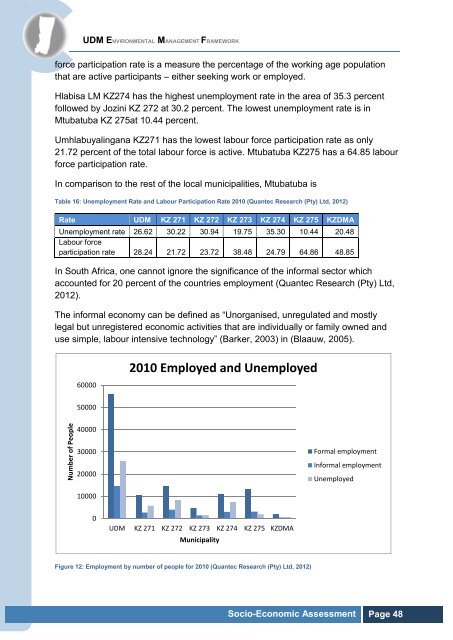
In South Africa, one cannot ignore the significance <strong>of</strong> the informal sector which<br />
accounted for 20 percent <strong>of</strong> the countries employment (Quantec Research (Pty) Ltd,<br />
2012).<br />
The informal economy can be defined as “Unorganised, unregulated <strong>and</strong> mostly<br />
legal but unregistered economic activities that are individually or family owned <strong>and</strong><br />
use simple, labour intensive technology” (Barker, 2003) in (Blaauw, 2005).<br />
60000<br />
2010 Employed <strong>and</strong> Unemployed<br />
50000<br />
Number <strong>of</strong> People<br />
40000<br />
30000<br />
20000<br />
10000<br />
Formal employment<br />
Informal employment<br />
Unemployed<br />
0<br />
UDM KZ 271 KZ 272 KZ 273 KZ 274 KZ 275 KZDMA<br />
Municipality<br />
Figure 12: Employment by number <strong>of</strong> people for 2010 (Quantec Research (Pty) Ltd, 2012)<br />
<strong>Socio</strong>-<strong>Economic</strong> Assessment Page 48