Full report - SGI Canada
Full report - SGI Canada
Full report - SGI Canada

You also want an ePaper? Increase the reach of your titles
YUMPU automatically turns print PDFs into web optimized ePapers that Google loves.
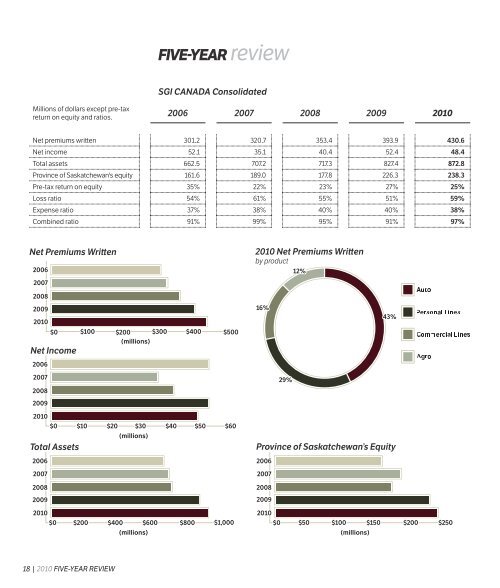
The impact of storm costs is further illustrated in the table below, detailing components of the 2010 loss<br />
ratio between storm and non-storm claim costs:<br />
Loss Ratios<br />
Manitoba’s loss ratio increased to 62.9% from 47.7% in 2009, and was impacted by a severe rainstorm in<br />
late May. Further contributing to the increase were losses relating to several large property fires in 2010.<br />
Alberta’s loss ratio is higher than the prior year, at 63.2% compared to 57.3% in 2009. The 2010 claim results<br />
were largely impacted by two significant rain/hailstorms in June and July.<br />
Ontario’s loss ratio decreased to 75.2% in 2010 (2009 – 84.5%), with the improvement resulting from<br />
personal and commercial property loss ratios. Auto results have deteriorated, a result of higher injury claim<br />
severity and inherent uncertainty in the Ontario auto market.<br />
The loss ratio for the Maritimes operations decreased to 54.5% in 2010 (2009 – 59.4%), primarily due to<br />
better results in personal business compared to 2009.<br />
Expenses excluding claims incurred<br />
Other expenses of $154.4 million increased $7.3 million or 4.7% in 2010. The increase was primarily attributable<br />
to higher broker commissions and premium taxes, however the commission and premium tax ratio<br />
decreased from 26.5% in 2009 to 25.5% in 2010. While administrative expenses increased $1.3 million<br />
(2.7%) in 2010, the administrative expense ratio declined to 12.2% from 13.1% in 2009, a combination of<br />
the relatively low expense growth and significant growth in premiums. The 2.7% growth in administrative<br />
expenses was largely due to staffing costs. Also included in the 2010 underwriting results is a $786,000<br />
gain related to participation in the Facility Association (2009 – a loss of $482,000).<br />
Investment earnings<br />
Investment earnings contribute significantly to net income and help minimize volatility in insurance rates.<br />
Investment earnings consist of interest and dividend income, net of investment expenses and realized<br />
gains (losses) on investments. The amount of realized gains or losses on sale of investments can<br />
fluctuate from year-to-year depending on the size of the unrealized gains in the portfolio, the changes in<br />
interest rates and the trading activity in the investment portfolio.<br />
The impact of the storms was the primary driver of the increase in the 2010 consolidated loss ratio.<br />
Removing the storms, the consolidated loss ratio is 50.4% in both 2010 and 2009. The following<br />
graph shows the significance of storm claims over the past 10 years and demonstrates the increasing<br />
unpredictability:<br />
Saskatchewan Storm Claims (net)<br />
Investment earnings in 2010 of $38.3 million were $18.7 million higher than the previous year’s earnings of<br />
$19.6 million. Investment earnings consisted of $21.4 million in interest and dividends (2009 – $21.3 million),<br />
and $16.9 million in realized gains on sale of investments, net of write-downs (2009 – $1.7 million loss).<br />
The following chart shows the breakdown of investment earnings between interest and dividends and net<br />
realized gains (losses) over the last 10 years:<br />
<strong>SGI</strong> CANADA Consolidated Investment Earnings<br />
36 | 2010 MANAGEMENT’S DISCUSSION AND ANALYSIS MANAGEMENT’S DISCUSSION AND ANALYSIS 2010 | 37