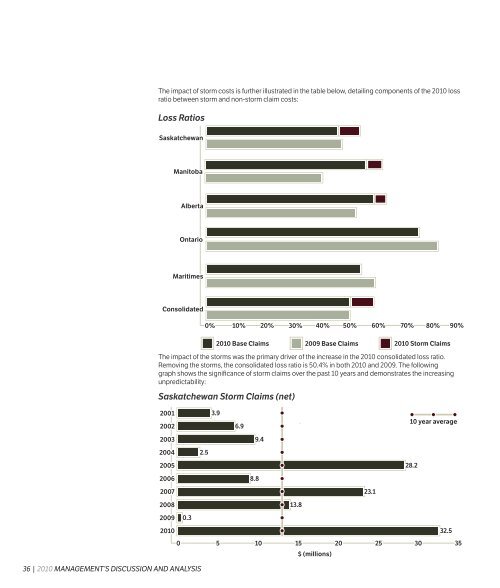
Full report - SGI Canada
Full report - SGI Canada
Full report - SGI Canada

You also want an ePaper? Increase the reach of your titles
YUMPU automatically turns print PDFs into web optimized ePapers that Google loves.
Term to maturity (years)<br />
The Corporation’s investment policy limits its holdings for any one issuer, other than the Government<br />
of <strong>Canada</strong> or a Canadian province, to 10% of the market value of the combined bond and short-term<br />
investment portfolios. The holdings for any one province are limited to 20% of the market value of the bond<br />
portfolio. Foreign currency exposure is limited to 5% of the market value of the bond portfolio, and no more<br />
than 10% of the market value of the bond portfolio shall be invested in securities of foreign issuers.<br />
The carrying value and average effective interest rates are shown in the following chart by contractual<br />
maturity. Actual maturity may differ from contractual maturity because certain borrowers have the right to<br />
call or prepay obligations with or without call or prepayment penalties.<br />
Carrying<br />
Value<br />
2010 2009<br />
Average<br />
Effective<br />
Rates<br />
(thousands of $)<br />
Carrying<br />
Value<br />
Average<br />
Effective<br />
Rates<br />
Government of <strong>Canada</strong>:<br />
One or less $ 8,882 1.4% $ — —<br />
After one through five 170,998 2.2% 143,765 2.3%<br />
After five — — 22,347 2.9%<br />
Canadian provincial and municipal:<br />
One or less 206 1.8% — —<br />
After one through five 40,886 2.3% 31,235 2.8%<br />
After five — — 36,795 4.5%<br />
Canadian corporate:<br />
One or less 3,815 2.0% 10,181 1.8%<br />
After one through five 108,956 2.7% 99,851 3.0%<br />
After five 33,242 4.1% 48,954 4.6%<br />
Total bonds and debentures $ 366,985 $ 393,128<br />
Common shares<br />
Common shares have no fixed maturity dates and are generally not exposed to interest rate risk. The<br />
average effective dividend rate is 1.8% (2009 – 2.2%).<br />
The Corporation’s investment policy limits its investment concentration in any one investee or related<br />
group of investees to 10% of the market value of the Corporation’s common shares portfolio. As well, no<br />
single holding may represent more than 10% of the voting shares of any corporation.<br />
Pooled funds<br />
The Corporation owns units in Canadian, United States and non-North American pooled equity funds and<br />
a pooled mortgage fund. These pooled funds have no fixed distribution rate. Fund returns are based on<br />
the success of the fund managers.<br />
Preferred shares<br />
The preferred share investment provides for a 6.75% annual dividend payable semi-annually for the first<br />
five years. The rights of these shares will allow the holder to convert the preferred shares into that entity’s<br />
common shares or allow the entity to redeem the preferred shares. The effective dividend rate is 6.8%<br />
(2009 – 6.8%).<br />
The Corporation’s investment policy limits its investment concentration in any one investee or related<br />
group of investees to 10% of the market value of the Corporation’s portfolio. As well, no single holding may<br />
represent more than 10% of the voting shares of any corporation.<br />
Investments accounted for on the equity basis<br />
During the year, the Corporation disposed of its 21.25% ownership interest in Charlie Cooke Insurance<br />
Agency Ltd. (CCIA) and its 25% interest in Maritime Finance and Acceptance Corporation (MFAC) and<br />
Atlantic Adjusting and Appraisals Ltd. (AAA) for total proceeds of $1,489,000. After recording income of<br />
$205,000 and receiving $35,000 of dividends during the year, the net book value of these companies<br />
was $1,507,000, resulting in a net loss on sale of $18,000. The purchasers are affiliated with the minority<br />
shareholder of ICPEI, who is a member of ICPEI’s senior management. The transactions were in the normal<br />
course of operations.<br />
Unrealized loss positions<br />
The following table presents available for sale investments with unrealized losses where the decline<br />
is considered temporary. The unrealized losses are recorded as a component of accumulated other<br />
comprehensive income (loss).<br />
2010 2009<br />
(thousands of $)<br />
Carrying Value Unrealized Losses Carrying Value Unrealized Losses<br />
Bonds and debentures:<br />
Federal $ 8,882 $ (3) $ 87,165 $ (491)<br />
Provincial and municipal 5,458 (33) 20,956 (247)<br />
Corporate 20,953 (106) 29,046 (365)<br />
Canadian common shares 9,972 (543) 7,694 (465)<br />
U.S. common shares 3,760 (301) 7,176 (498)<br />
Pooled funds:<br />
Canadian equity — — 17,287 (1,807)<br />
United States equity — — 7,529 (195)<br />
Non-North American equity — — 26,747 (296)<br />
$ 49,025 $ (986) $ 203,600 $ (4,364)<br />
72 | 2010 NOTES TO THE CONSOLIDATED FINANCIAL STATEMENTS NOTES TO THE CONSOLIDATED FINANCIAL STATEMENTS 2010 | 73