Dental Press
Dental Press
Dental Press

Create successful ePaper yourself
Turn your PDF publications into a flip-book with our unique Google optimized e-Paper software.
[ original article ] Efficacy of chemo-mechanical preparation with different substances and the use of a root canal medication in dog’s teeth with induced periapical lesion<br />
Microbial characterization<br />
Preliminary characterization of microbial species<br />
were based on colony features (i.e. size, color, shape,<br />
height, lip, surface, texture, consistency, brightness and<br />
hemolysis) visualized under a stereoscopic lens (Lambda<br />
Let 2, Atto instruments Co., Hong Kong). Isolates<br />
were purified by subculture. Gram-stained and gaseous<br />
requirements were established by incubation for 2 days<br />
under aerobic and anaerobic environments.<br />
Based on microbial colony features, Gram-stain and<br />
gaseous requirements, it was possible to determine the<br />
microbiota profile from root canals at different samplings<br />
moments (s1, s2, s3).<br />
Statistics<br />
Statistical comparisons were made between all<br />
groups (I-V) at the same samplings moments (s1, s2<br />
or s3) and between s1, s2 and s3 in each group using<br />
the Kruskall-wallis test for non-parametric data (CFU<br />
counts, percentages of gram-positive rods and cocci,<br />
percentages of facultative and strict anaerobes species).<br />
When significant differences were found in the Kruskallwallis<br />
test, Mann-Whitney test was performed to demonstrate<br />
where the differences were located. P-values<br />
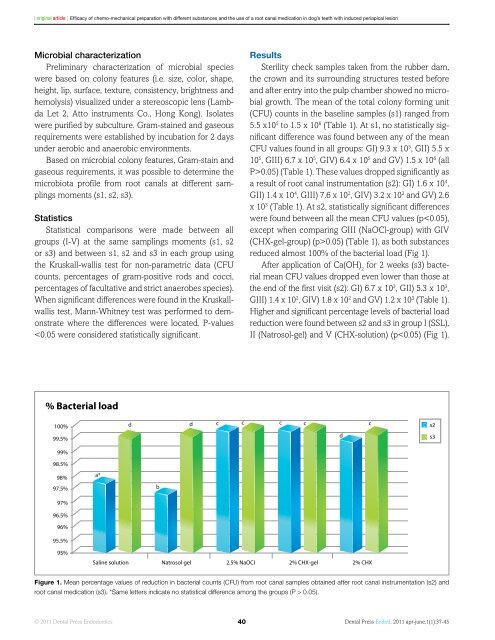
0.05) (Table 1). These values dropped significantly as<br />
a result of root canal instrumentation (s2): GI) 1.6 x 10 4 ,<br />
GII) 1.4 x 10 4 , GIII) 7.6 x 10 2 , GIV) 3.2 x 10 2 and GV) 2.6<br />
x 10 3 (Table 1). At s2, statistically significant differences<br />
were found between all the mean CFU values (p0.05) (Table 1), as both substances<br />
reduced almost 100% of the bacterial load (Fig 1).<br />
After application of Ca(OH) 2<br />
for 2 weeks (s3) bacterial<br />
mean CFU values dropped even lower than those at<br />
the end of the first visit (s2): GI) 6.7 x 10 3 , GII) 5.3 x 10 3 ,<br />
GIII) 1.4 x 10 2 , GIV) 1.8 x 10 2 and GV) 1.2 x 10 3 (Table 1).<br />
Higher and significant percentage levels of bacterial load<br />
reduction were found between s2 and s3 in group I (SSL),<br />
II (Natrosol-gel) and V (CHX-solution) (p 0.05).<br />
© 2011 <strong>Dental</strong> <strong>Press</strong> Endodontics 40<br />
<strong>Dental</strong> <strong>Press</strong> Endod. 2011 apr-june;1(1):37-45