Introduction to Quartus® II
Introduction to Quartus® II
Introduction to Quartus® II

You also want an ePaper? Increase the reach of your titles
YUMPU automatically turns print PDFs into web optimized ePapers that Google loves.
CHAPTER 9: TIMING CLOSURE<br />
USING THE TIMING CLOSURE FLOORPLAN<br />
■<br />
■<br />
■<br />
■<br />
■<br />
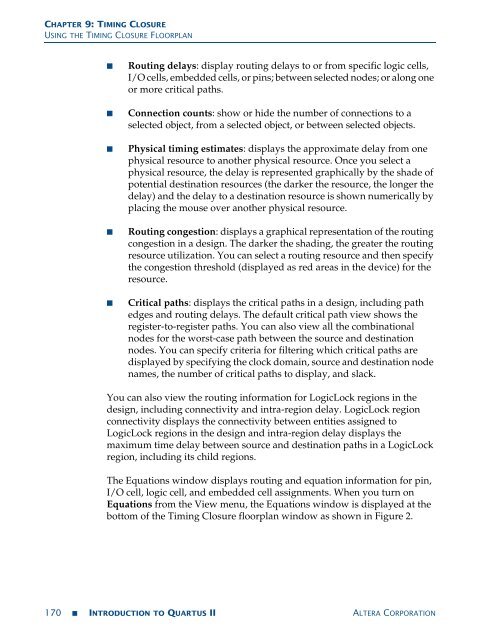
Routing delays: display routing delays <strong>to</strong> or from specific logic cells,<br />
I/O cells, embedded cells, or pins; between selected nodes; or along one<br />
or more critical paths.<br />
Connection counts: show or hide the number of connections <strong>to</strong> a<br />
selected object, from a selected object, or between selected objects.<br />
Physical timing estimates: displays the approximate delay from one<br />
physical resource <strong>to</strong> another physical resource. Once you select a<br />
physical resource, the delay is represented graphically by the shade of<br />
potential destination resources (the darker the resource, the longer the<br />
delay) and the delay <strong>to</strong> a destination resource is shown numerically by<br />
placing the mouse over another physical resource.<br />
Routing congestion: displays a graphical representation of the routing<br />
congestion in a design. The darker the shading, the greater the routing<br />
resource utilization. You can select a routing resource and then specify<br />
the congestion threshold (displayed as red areas in the device) for the<br />
resource.<br />
Critical paths: displays the critical paths in a design, including path<br />
edges and routing delays. The default critical path view shows the<br />
register-<strong>to</strong>-register paths. You can also view all the combinational<br />
nodes for the worst-case path between the source and destination<br />
nodes. You can specify criteria for filtering which critical paths are<br />
displayed by specifying the clock domain, source and destination node<br />
names, the number of critical paths <strong>to</strong> display, and slack.<br />
You can also view the routing information for LogicLock regions in the<br />
design, including connectivity and intra-region delay. LogicLock region<br />
connectivity displays the connectivity between entities assigned <strong>to</strong><br />
LogicLock regions in the design and intra-region delay displays the<br />
maximum time delay between source and destination paths in a LogicLock<br />
region, including its child regions.<br />
The Equations window displays routing and equation information for pin,<br />
I/O cell, logic cell, and embedded cell assignments. When you turn on<br />
Equations from the View menu, the Equations window is displayed at the<br />
bot<strong>to</strong>m of the Timing Closure floorplan window as shown in Figure 2.<br />
170 ■ INTRODUCTION TO QUARTUS <strong>II</strong> ALTERA CORPORATION