Apr-Jun.12 - the Nitie
Apr-Jun.12 - the Nitie
Apr-Jun.12 - the Nitie

You also want an ePaper? Increase the reach of your titles
YUMPU automatically turns print PDFs into web optimized ePapers that Google loves.
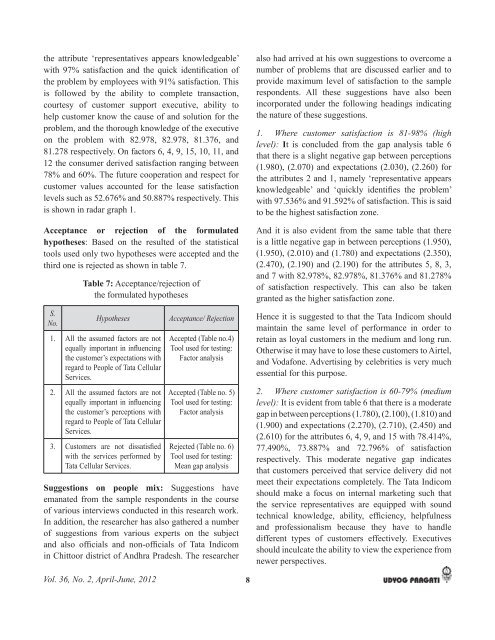
<strong>the</strong> attribute ‘representatives appears knowledgeable’<br />
<br />
<strong>the</strong> problem by employees with 91% satisfaction. This<br />
is followed by <strong>the</strong> ability to complete transaction,<br />
courtesy of customer support executive, ability to<br />
help customer know <strong>the</strong> cause of and solution for <strong>the</strong><br />
problem, and <strong>the</strong> thorough knowledge of <strong>the</strong> executive<br />
on <strong>the</strong> problem with 82.978, 82.978, 81.376, and<br />
81.278 respectively. On factors 6, 4, 9, 15, 10, 11, and<br />
12 <strong>the</strong> consumer derived satisfaction ranging between<br />
78% and 60%. The future cooperation and respect for<br />
customer values accounted for <strong>the</strong> lease satisfaction<br />
levels such as 52.676% and 50.887% respectively. This<br />
is shown in radar graph 1.<br />
Acceptance or rejection of <strong>the</strong> formulated<br />
hypo<strong>the</strong>ses <br />
tools used only two hypo<strong>the</strong>ses were accepted and <strong>the</strong><br />
third one is rejected as shown in table 7.<br />
Table 7: Acceptance/rejection of<br />
<strong>the</strong> formulated hypo<strong>the</strong>ses<br />
S.<br />
<br />
No.<br />
1. All <strong>the</strong> assumed factors are not<br />
<br />
<strong>the</strong> customer’s expectations with<br />
regard to People of Tata Cellular<br />
Services.<br />
2. All <strong>the</strong> assumed factors are not<br />
<br />
<strong>the</strong> customer’s perceptions with<br />
regard to People of Tata Cellular<br />
Services.<br />
3. <br />
with <strong>the</strong> services performed by<br />
Tata Cellular Services.<br />
<br />
Accepted (Table no.4)<br />
Tool used for testing:<br />
Factor analysis<br />
Accepted (Table no. 5)<br />
Tool used for testing:<br />
Factor analysis<br />
Rejected (Table no. 6)<br />
Tool used for testing:<br />
Mean gap analysis<br />
Suggestions on people mix: Suggestions have<br />
emanated from <strong>the</strong> sample respondents in <strong>the</strong> course<br />
of various interviews conducted in this research work.<br />
In addition, <strong>the</strong> researcher has also ga<strong>the</strong>red a number<br />
of suggestions from various experts on <strong>the</strong> subject<br />
<br />
in Chittoor district of Andhra Pradesh. The researcher<br />
also had arrived at his own suggestions to overcome a<br />
number of problems that are discussed earlier and to<br />
provide maximum level of satisfaction to <strong>the</strong> sample<br />
respondents. All <strong>the</strong>se suggestions have also been<br />
incorporated under <strong>the</strong> following headings indicating<br />
<strong>the</strong> nature of <strong>the</strong>se suggestions.<br />
<br />
It is concluded from <strong>the</strong> gap analysis table 6<br />
that <strong>the</strong>re is a slight negative gap between perceptions<br />
(1.980), (2.070) and expectations (2.030), (2.260) for<br />
<strong>the</strong> attributes 2 and 1, namely ‘representative appears<br />
<br />
with 97.536% and 91.592% of satisfaction. This is said<br />
to be <strong>the</strong> highest satisfaction zone.<br />
And it is also evident from <strong>the</strong> same table that <strong>the</strong>re<br />
is a little negative gap in between perceptions (1.950),<br />
(1.950), (2.010) and (1.780) and expectations (2.350),<br />
(2.470), (2.190) and (2.190) for <strong>the</strong> attributes 5, 8, 3,<br />
and 7 with 82.978%, 82.978%, 81.376% and 81.278%<br />
of satisfaction respectively. This can also be taken<br />
granted as <strong>the</strong> higher satisfaction zone.<br />
Hence it is suggested to that <strong>the</strong> Tata Indicom should<br />
maintain <strong>the</strong> same level of performance in order to<br />
retain as loyal customers in <strong>the</strong> medium and long run.<br />
O<strong>the</strong>rwise it may have to lose <strong>the</strong>se customers to Airtel,<br />
and Vodafone. Advertising by celebrities is very much<br />
essential for this purpose.<br />
<br />
It is evident from table 6 that <strong>the</strong>re is a moderate<br />
gap in between perceptions (1.780), (2.100), (1.810) and<br />
(1.900) and expectations (2.270), (2.710), (2.450) and<br />
(2.610) for <strong>the</strong> attributes 6, 4, 9, and 15 with 78.414%,<br />
77.490%, 73.887% and 72.796% of satisfaction<br />
respectively. This moderate negative gap indicates<br />
that customers perceived that service delivery did not<br />
meet <strong>the</strong>ir expectations completely. The Tata Indicom<br />
should make a focus on internal marketing such that<br />
<strong>the</strong> service representatives are equipped with sound<br />
<br />
and professionalism because <strong>the</strong>y have to handle<br />
different types of customers effectively. Executives<br />
should inculcate <strong>the</strong> ability to view <strong>the</strong> experience from<br />
newer perspectives.<br />
Vol. 36, No. 2, <strong>Apr</strong>il-June, 2012<br />
8