Apr-Jun.12 - the Nitie
Apr-Jun.12 - the Nitie
Apr-Jun.12 - the Nitie

You also want an ePaper? Increase the reach of your titles
YUMPU automatically turns print PDFs into web optimized ePapers that Google loves.
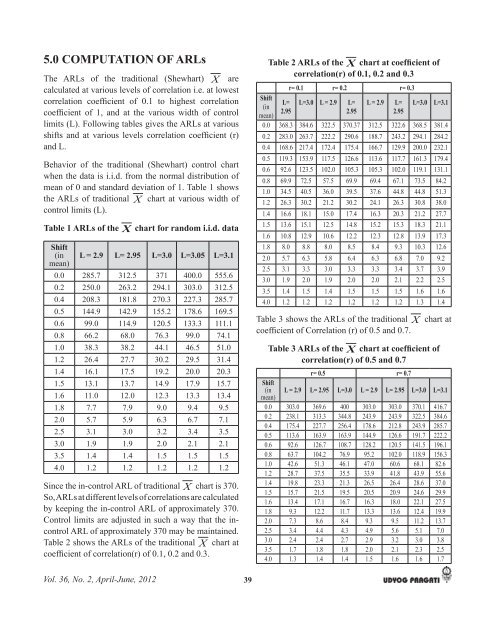
5.0 COMPUTATION OF ARLs<br />
The ARLs of <strong>the</strong> traditional (Shewhart) are<br />
calculated at various levels of correlation i.e. at lowest<br />
<br />
<br />
limits (L). Following tables gives <strong>the</strong> ARLs at various<br />
<br />
and L.<br />
Behavior of <strong>the</strong> traditional (Shewhart) control chart<br />
when <strong>the</strong> data is i.i.d. from <strong>the</strong> normal distribution of<br />
mean of 0 and standard deviation of 1. Table 1 shows<br />
<strong>the</strong> ARLs of traditional chart at various width of<br />
control limits (L).<br />
Table 1 ARLs of <strong>the</strong><br />
chart for random i.i.d. data<br />
Shift<br />
(in L = 2.9 L= 2.95 L=3.0 L=3.05 L=3.1<br />
mean)<br />
0.0 285.7 312.5 371 400.0 555.6<br />
0.2 250.0 263.2 294.1 303.0 312.5<br />
0.4 208.3 181.8 270.3 227.3 285.7<br />
0.5 144.9 142.9 155.2 178.6 169.5<br />
0.6 99.0 114.9 120.5 133.3 111.1<br />
0.8 66.2 68.0 76.3 99.0 74.1<br />
1.0 38.3 38.2 44.1 46.5 51.0<br />
1.2 26.4 27.7 30.2 29.5 31.4<br />
1.4 16.1 17.5 19.2 20.0 20.3<br />
1.5 13.1 13.7 14.9 17.9 15.7<br />
1.6 11.0 12.0 12.3 13.3 13.4<br />
1.8 7.7 7.9 9.0 9.4 9.5<br />
2.0 5.7 5.9 6.3 6.7 7.1<br />
2.5 3.1 3.0 3.2 3.4 3.5<br />
3.0 1.9 1.9 2.0 2.1 2.1<br />
3.5 1.4 1.4 1.5 1.5 1.5<br />
4.0 1.2 1.2 1.2 1.2 1.2<br />
Since <strong>the</strong> in-control ARL of traditional chart is 370.<br />
So, ARLs at different levels of correlations are calculated<br />
by keeping <strong>the</strong> in-control ARL of approximately 370.<br />
Control limits are adjusted in such a way that <strong>the</strong> incontrol<br />
ARL of approximately 370 may be maintained.<br />
Table 2 shows <strong>the</strong> ARLs of <strong>the</strong> traditional chart at<br />
<br />
Shift<br />
(in<br />
mean)<br />
Table 2 ARLs of <strong>the</strong> <br />
correlation(r) of 0.1, 0.2 and 0.3<br />
L=<br />
2.95<br />
r= 0.1 r= 0.2 r= 0.3<br />
L=3.0 L = 2.9 L=<br />
2.95<br />
L = 2.9 L=<br />
2.95<br />
L=3.0<br />
L=3.1<br />
0.0 368.3 384.6 322.5 370.37 312.5 322.6 368.5 381.4<br />
0.2 283.0 263.7 222.2 290.6 188.7 243.2 294.1 284.2<br />
0.4 168.6 217.4 172.4 175.4 166.7 129.9 200.0 232.1<br />
0.5 119.3 153.9 117.5 126.6 113.6 117.7 161.3 179.4<br />
0.6 92.6 123.5 102.0 105.3 105.3 102.0 119.1 131.1<br />
0.8 69.9 72.5 57.5 69.9 69.4 67.1 73.5 84.2<br />
1.0 34.5 40.5 36.0 39.5 37.6 44.8 44.8 51.3<br />
1.2 26.3 30.2 21.2 30.2 24.1 26.3 30.8 38.0<br />
1.4 16.6 18.1 15.0 17.4 16.3 20.3 21.2 27.7<br />
1.5 13.6 15.1 12.5 14.8 15.2 15.3 18.3 21.1<br />
1.6 10.8 12.9 10.6 12.2 12.3 12.8 13.9 17.3<br />
1.8 8.0 8.8 8.0 8.5 8.4 9.3 10.3 12.6<br />
2.0 5.7 6.3 5.8 6.4 6.3 6.8 7.0 9.2<br />
2.5 3.1 3.3 3.0 3.3 3.3 3.4 3.7 3.9<br />
3.0 1.9 2.0 1.9 2.0 2.0 2.1 2.2 2.5<br />
3.5 1.4 1.5 1.4 1.5 1.5 1.5 1.6 1.6<br />
4.0 1.2 1.2 1.2 1.2 1.2 1.2 1.3 1.4<br />
Table 3 shows <strong>the</strong> ARLs of <strong>the</strong> traditional<br />
<br />
chart at<br />
Table 3 ARLs of <strong>the</strong> <br />
correlation(r) of 0.5 and 0.7<br />
r= 0.5 r= 0.7<br />
Shift<br />
(in L = 2.9 L= 2.95 L=3.0 L = 2.9 L= 2.95 L=3.0 L=3.1<br />
mean)<br />
0.0 303.0 369.6 400 303.0 303.0 370.1 416.7<br />
0.2 238.1 313.3 344.8 243.9 243.9 322.5 384.6<br />
0.4 175.4 227.7 256.4 178.6 212.8 243.9 285.7<br />
0.5 113.6 163.9 163.9 144.9 126.6 191.7 222.2<br />
0.6 92.6 126.7 108.7 128.2 120.5 141.5 196.1<br />
0.8 63.7 104.2 76.9 95.2 102.0 118.9 156.3<br />
1.0 42.6 51.3 46.1 47.0 60.6 68.1 82.6<br />
1.2 28.7 37.5 35.5 33.9 41.8 43.9 55.6<br />
1.4 19.8 23.3 21.3 26.5 26.4 28.6 37.0<br />
1.5 15.7 21.5 19.5 20.5 20.9 24.6 29.9<br />
1.6 13.4 17.1 16.7 16.3 18.0 22.1 27.5<br />
1.8 9.3 12.2 11.7 13.3 13.6 12.4 19.9<br />
2.0 7.3 8.6 8.4 9.3 9.5 11.2 13.7<br />
2.5 3.4 4.4 4.3 4.9 5.6 5.1 7.0<br />
3.0 2.4 2.4 2.7 2.9 3.2 3.0 3.8<br />
3.5 1.7 1.8 1.8 2.0 2.1 2.3 2.5<br />
4.0 1.3 1.4 1.4 1.5 1.6 1.6 1.7<br />
Vol. 36, No. 2, <strong>Apr</strong>il-June, 2012<br />
39