Apr-Jun.12 - the Nitie
Apr-Jun.12 - the Nitie
Apr-Jun.12 - the Nitie

You also want an ePaper? Increase the reach of your titles
YUMPU automatically turns print PDFs into web optimized ePapers that Google loves.
The presence of autocorrelation in <strong>the</strong> processes gives<br />
a profound effect on control charts developed for i.i.d<br />
observations. When such an autocorrelation exists,<br />
standard control charts may exhibit an increase in<br />
<strong>the</strong> frequency of false alarms. There is an increased<br />
likelihood that <strong>the</strong> data will exhibit autocorrelation in<br />
systems where <strong>the</strong> process time is longer than <strong>the</strong> time<br />
between samples collected.<br />
Several researchers have examined control chart<br />
behavior in <strong>the</strong> presence of autocorrelation. If process<br />
measurements are autocorrelated, <strong>the</strong>n standard<br />
constructions of control charts will violate <strong>the</strong><br />
assumption that samples are independent. In-control<br />
ARL is reduced due to <strong>the</strong> autocorrelation in <strong>the</strong> data;<br />
moreover it also affects <strong>the</strong> behavior of <strong>the</strong> Shewhart<br />
control chart at various shifts. A quality engineer<br />
will search <strong>the</strong> assignable causes behind <strong>the</strong> more<br />
number of <strong>the</strong> false alarms at different shifts but will<br />
found nothing. This is how <strong>the</strong> autocorrelation in <strong>the</strong><br />
measured data affects <strong>the</strong> performance of <strong>the</strong> control<br />
chart. The type 1 error rate for control charts is sensitive<br />
to autocorrelated data; that is, control charts are subject<br />
to increased false alarms and, hence, shorter Average<br />
Run Lengths (ARLs). Even at low levels of correlation,<br />
dramatic disturbances can occur in <strong>the</strong> chart properties.<br />
In <strong>the</strong> industry, if <strong>the</strong>re is autocorrelation, <strong>the</strong>n <strong>the</strong><br />
autocorrelated data is normally distributed. The<br />
autocorrelated data can be generated from a set of<br />
uniformally distributed data with mean of 0 and<br />
standard deviation of 1 with <strong>the</strong> help of <strong>the</strong> MATLAB.<br />
The autocorrelated data is generated from <strong>the</strong> normally<br />
distributed data. Figure 3 clearly shows that <strong>the</strong> 10,000<br />
correlated numbers are distributed normally.<br />
Figure 3 Distributions of 10,000 positively<br />
autocorrelated numbers<br />
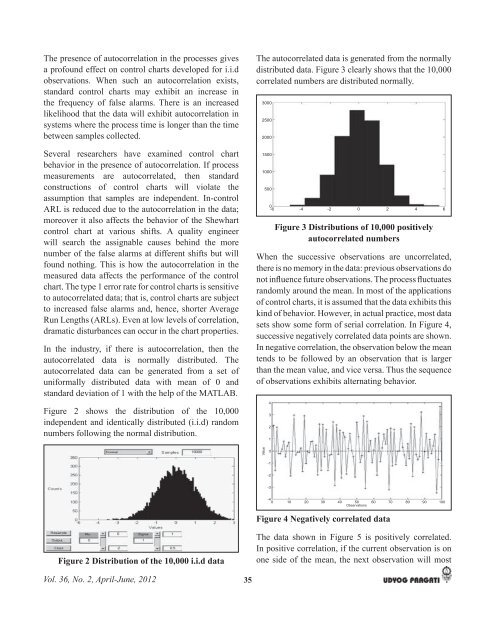
When <strong>the</strong> successive observations are uncorrelated,<br />
<strong>the</strong>re is no memory in <strong>the</strong> data: previous observations do<br />
<br />
randomly around <strong>the</strong> mean. In most of <strong>the</strong> applications<br />
of control charts, it is assumed that <strong>the</strong> data exhibits this<br />
kind of behavior. However, in actual practice, most data<br />
sets show some form of serial correlation. In Figure 4,<br />
successive negatively correlated data points are shown.<br />
In negative correlation, <strong>the</strong> observation below <strong>the</strong> mean<br />
tends to be followed by an observation that is larger<br />
than <strong>the</strong> mean value, and vice versa. Thus <strong>the</strong> sequence<br />
of observations exhibits alternating behavior.<br />
Figure 2 shows <strong>the</strong> distribution of <strong>the</strong> 10,000<br />
independent and identically distributed (i.i.d) random<br />
numbers following <strong>the</strong> normal distribution.<br />
Figure 4 Negatively correlated data<br />
Figure 2 Distribution of <strong>the</strong> 10,000 i.i.d data<br />
The data shown in Figure 5 is positively correlated.<br />
In positive correlation, if <strong>the</strong> current observation is on<br />
one side of <strong>the</strong> mean, <strong>the</strong> next observation will most<br />
Vol. 36, No. 2, <strong>Apr</strong>il-June, 2012<br />
35