Apr-Jun.12 - the Nitie
Apr-Jun.12 - the Nitie
Apr-Jun.12 - the Nitie

Create successful ePaper yourself
Turn your PDF publications into a flip-book with our unique Google optimized e-Paper software.
Performance of traditional<br />
chart with correlated data<br />
Sukhraj Singh*<br />
Dr. D. R. Prajapati**<br />
Shewhart charts are <strong>the</strong> prominent charts used to detect <strong>the</strong><br />
larger shifts in <strong>the</strong> mean of <strong>the</strong> process. They are widely used in<br />
<strong>the</strong> all type of <strong>the</strong> processes as well as in <strong>the</strong> service industries.<br />
It is usually assumed that <strong>the</strong> observations from <strong>the</strong> process<br />
output are independent and identically distributed (i.i.d.). But<br />
in actual practice, for many processes <strong>the</strong> observations are<br />
<br />
effect on <strong>the</strong> performance of <strong>the</strong> Shewhart (standard) chart.<br />
The performance of <strong>the</strong> traditional (Shewhart) chart is studied<br />
for <strong>the</strong> i.i.d. data and for <strong>the</strong> positively correlated data. The<br />
Average Run Lengths (ARLs) at various sets of parameters of<br />
<strong>the</strong> chart are computed by simulation, using <strong>the</strong> MATLAB<br />
software. The behavior of <strong>the</strong> chart at <strong>the</strong> various shifts in<br />
<strong>the</strong> process mean is studied and analyzed. It is concluded that<br />
when <strong>the</strong> level of correlation increases, both <strong>the</strong> false alarm<br />
rate and out of control ARL increase. In this paper, optimal<br />
schemes of <strong>the</strong> chart for each level of <strong>the</strong> correlation are<br />
suggested.<br />
Key Words: Traditional charts, Average run length,<br />
independent and identically distributed data, Autocorrelation,<br />
MATLAB<br />
INTRODUCTION<br />
Control charts are one of <strong>the</strong> powerful tools of <strong>the</strong><br />
Statistical Process Control (SPC) techniques, which are<br />
widely used in industry for process improvement and<br />
for estimating parameters or monitoring <strong>the</strong> variability<br />
of a given process. Shewhart charts were originally<br />
developed by Walter F. Shewhart (1931). The limits of<br />
<strong>the</strong> chart are known as upper control limit (UCL) and<br />
<br />
LCL = +<br />
<br />
deviation.<br />
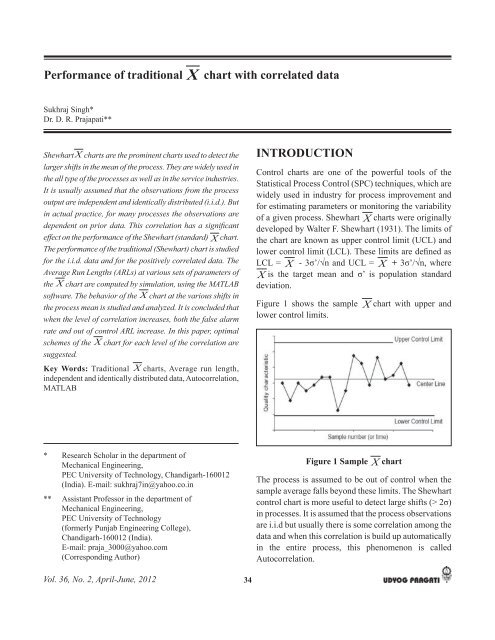
Figure 1 shows <strong>the</strong> sample<br />
lower control limits.<br />
chart with upper and<br />
* Research Scholar in <strong>the</strong> department of<br />
Mechanical Engineering,<br />
PEC University of Technology, Chandigarh-160012<br />
(India). E-mail: sukhraj7in@yahoo.co.in<br />
** Assistant Professor in <strong>the</strong> department of<br />
Mechanical Engineering,<br />
PEC University of Technology<br />
(formerly Punjab Engineering College),<br />
Chandigarh-160012 (India).<br />
E-mail: praja_3000@yahoo.com<br />
(Corresponding Author)<br />
Figure 1 Sample<br />
chart<br />
The process is assumed to be out of control when <strong>the</strong><br />
sample average falls beyond <strong>the</strong>se limits. The Shewhart<br />
<br />
in processes. It is assumed that <strong>the</strong> process observations<br />
are i.i.d but usually <strong>the</strong>re is some correlation among <strong>the</strong><br />
data and when this correlation is build up automatically<br />
in <strong>the</strong> entire process, this phenomenon is called<br />
Autocorrelation.<br />
Vol. 36, No. 2, <strong>Apr</strong>il-June, 2012<br />
34