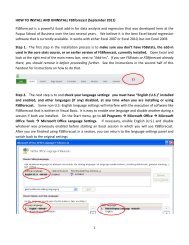
How to use FSBforecast Excel add-in for regression analysis
How to use FSBforecast Excel add-in for regression analysis
How to use FSBforecast Excel add-in for regression analysis

You also want an ePaper? Increase the reach of your titles
YUMPU automatically turns print PDFs into web optimized ePapers that Google loves.
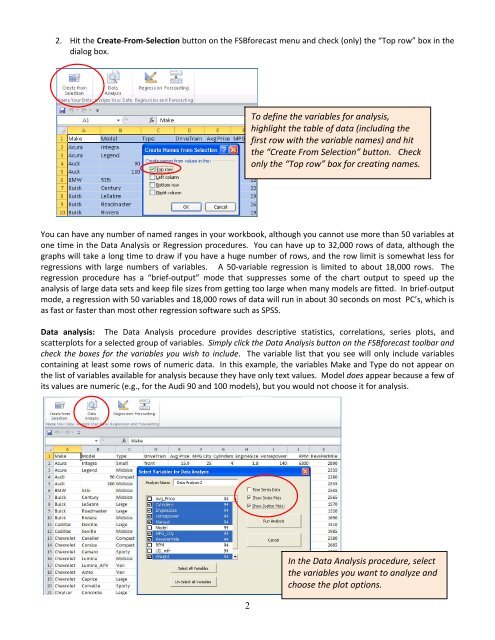
2. Hit the Create‐From‐Selection but<strong>to</strong>n on the <strong>FSB<strong>for</strong>ecast</strong> menu and check (only) the “Top row” box <strong>in</strong> the<br />
dialog box.<br />
To def<strong>in</strong>e the variables <strong>for</strong> <strong>analysis</strong>,<br />
highlight the table of data (<strong>in</strong>clud<strong>in</strong>g the<br />
first row with the variable names) and hit<br />
the “Create From Selection” but<strong>to</strong>n. Check<br />
only the “Top row” box <strong>for</strong> creat<strong>in</strong>g names.<br />
You can have any number of named ranges <strong>in</strong> your workbook, although you cannot <strong>use</strong> more than 50 variables at<br />
one time <strong>in</strong> the Data Analysis or Regression procedures. You can have up <strong>to</strong> 32,000 rows of data, although the<br />
graphs will take a long time <strong>to</strong> draw if you have a huge number of rows, and the row limit is somewhat less <strong>for</strong><br />
<strong>regression</strong>s with large numbers of variables. A 50‐variable <strong>regression</strong> is limited <strong>to</strong> about 18,000 rows. The<br />
<strong>regression</strong> procedure has a “brief‐output” mode that suppresses some of the chart output <strong>to</strong> speed up the<br />
<strong>analysis</strong> of large data sets and keep file sizes from gett<strong>in</strong>g <strong>to</strong>o large when many models are fitted. In brief‐output<br />
mode, a <strong>regression</strong> with 50 variables and 18,000 rows of data will run <strong>in</strong> about 30 seconds on most PC’s, which is<br />
as fast or faster than most other <strong>regression</strong> software such as SPSS.<br />
Data <strong>analysis</strong>: The Data Analysis procedure provides descriptive statistics, correlations, series plots, and<br />
scatterplots <strong>for</strong> a selected group of variables. Simply click the Data Analysis but<strong>to</strong>n on the <strong>FSB<strong>for</strong>ecast</strong> <strong>to</strong>olbar and<br />
check the boxes <strong>for</strong> the variables you wish <strong>to</strong> <strong>in</strong>clude. The variable list that you see will only <strong>in</strong>clude variables<br />
conta<strong>in</strong><strong>in</strong>g at least some rows of numeric data. In this example, the variables Make and Type do not appear on<br />
the list of variables available <strong>for</strong> <strong>analysis</strong> beca<strong>use</strong> they have only text values. Model does appear beca<strong>use</strong> a few of<br />
its values are numeric (e.g., <strong>for</strong> the Audi 90 and 100 models), but you would not choose it <strong>for</strong> <strong>analysis</strong>.<br />
2<br />
In the Data Analysis procedure, select<br />
the variables you want <strong>to</strong> analyze and<br />
choose the plot options.