How to use FSBforecast Excel add-in for regression analysis
How to use FSBforecast Excel add-in for regression analysis
How to use FSBforecast Excel add-in for regression analysis

Create successful ePaper yourself
Turn your PDF publications into a flip-book with our unique Google optimized e-Paper software.
There is also a Set Intercept <strong>to</strong> 0 option, which <strong>for</strong>ces the <strong>in</strong>tercept <strong>to</strong> be zero <strong>in</strong> the equation. In the special case<br />
of a simple (1‐variable) <strong>regression</strong> model, this means that the <strong>regression</strong> l<strong>in</strong>e is a straight l<strong>in</strong>e that passes through<br />
the orig<strong>in</strong>, i.e., the po<strong>in</strong>t (0, 0) <strong>in</strong> the X‐Y plane. If you <strong>use</strong> this option, values <strong>for</strong> R‐squared and adjusted R‐<br />
squared are not computed, beca<strong>use</strong> they do not have the same mean<strong>in</strong>g <strong>for</strong> a model that does not <strong>in</strong>clude an<br />
<strong>in</strong>tercept and there is no universally accepted way of def<strong>in</strong><strong>in</strong>g them <strong>in</strong> this situation.<br />
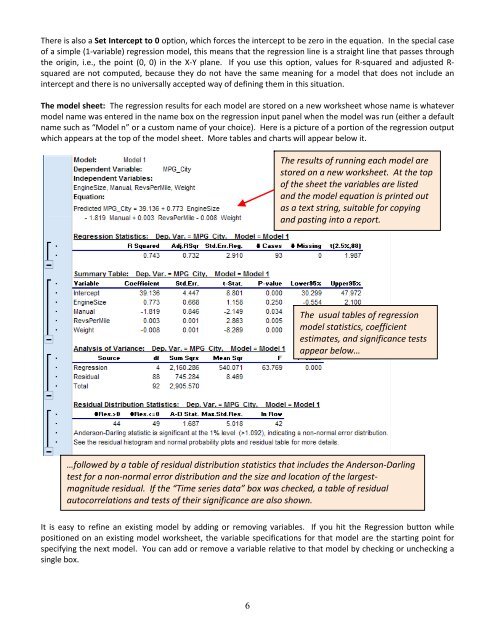
The model sheet: The <strong>regression</strong> results <strong>for</strong> each model are s<strong>to</strong>red on a new worksheet whose name is whatever<br />
model name was entered <strong>in</strong> the name box on the <strong>regression</strong> <strong>in</strong>put panel when the model was run (either a default<br />
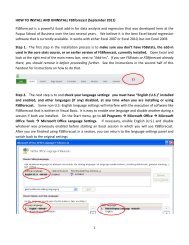
name such as “Model n” or a cus<strong>to</strong>m name of your choice). Here is a picture of a portion of the <strong>regression</strong> output<br />
which appears at the <strong>to</strong>p of the model sheet. More tables and charts will appear below it.<br />
The results of runn<strong>in</strong>g each model are<br />
s<strong>to</strong>red on a new worksheet. At the <strong>to</strong>p<br />
of the sheet the variables are listed<br />
and the model equation is pr<strong>in</strong>ted out<br />
as a text str<strong>in</strong>g, suitable <strong>for</strong> copy<strong>in</strong>g<br />
and past<strong>in</strong>g <strong>in</strong><strong>to</strong> a report.<br />
The usual tables of <strong>regression</strong><br />
model statistics, coefficient<br />
estimates, and significance tests<br />
appear below…<br />
…followed by a table of residual distribution statistics that <strong>in</strong>cludes the Anderson‐Darl<strong>in</strong>g<br />
test <strong>for</strong> a non‐normal error distribution and the size and location of the largestmagnitude<br />
residual. If the “Time series data” box was checked, a table of residual<br />
au<strong>to</strong>correlations and tests of their significance are also shown.<br />
It is easy <strong>to</strong> ref<strong>in</strong>e an exist<strong>in</strong>g model by <strong>add</strong><strong>in</strong>g or remov<strong>in</strong>g variables. If you hit the Regression but<strong>to</strong>n while<br />
positioned on an exist<strong>in</strong>g model worksheet, the variable specifications <strong>for</strong> that model are the start<strong>in</strong>g po<strong>in</strong>t <strong>for</strong><br />
specify<strong>in</strong>g the next model. You can <strong>add</strong> or remove a variable relative <strong>to</strong> that model by check<strong>in</strong>g or uncheck<strong>in</strong>g a<br />
s<strong>in</strong>gle box.<br />
6