How to use FSBforecast Excel add-in for regression analysis
How to use FSBforecast Excel add-in for regression analysis
How to use FSBforecast Excel add-in for regression analysis

Create successful ePaper yourself
Turn your PDF publications into a flip-book with our unique Google optimized e-Paper software.
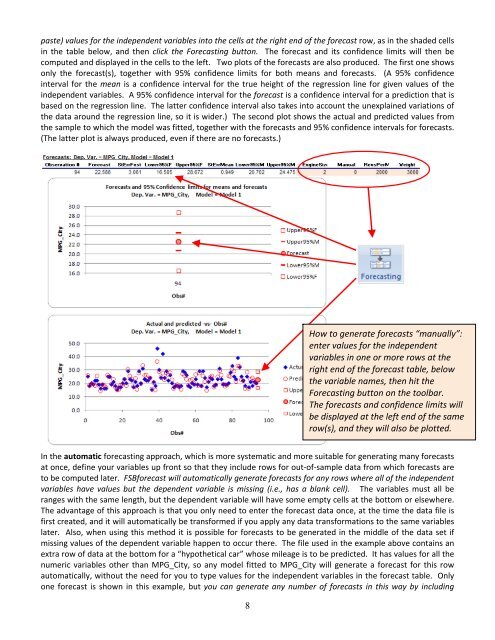
paste) values <strong>for</strong> the <strong>in</strong>dependent variables <strong>in</strong><strong>to</strong> the cells at the right end of the <strong>for</strong>ecast row, as <strong>in</strong> the shaded cells<br />
<strong>in</strong> the table below, and then click the Forecast<strong>in</strong>g but<strong>to</strong>n. The <strong>for</strong>ecast and its confidence limits will then be<br />
computed and displayed <strong>in</strong> the cells <strong>to</strong> the left. Two plots of the <strong>for</strong>ecasts are also produced. The first one shows<br />
only the <strong>for</strong>ecast(s), <strong>to</strong>gether with 95% confidence limits <strong>for</strong> both means and <strong>for</strong>ecasts. (A 95% confidence<br />
<strong>in</strong>terval <strong>for</strong> the mean is a confidence <strong>in</strong>terval <strong>for</strong> the true height of the <strong>regression</strong> l<strong>in</strong>e <strong>for</strong> given values of the<br />
<strong>in</strong>dependent variables. A 95% confidence <strong>in</strong>terval <strong>for</strong> the <strong>for</strong>ecast is a confidence <strong>in</strong>terval <strong>for</strong> a prediction that is<br />
based on the <strong>regression</strong> l<strong>in</strong>e. The latter confidence <strong>in</strong>terval also takes <strong>in</strong><strong>to</strong> account the unexpla<strong>in</strong>ed variations of<br />
the data around the <strong>regression</strong> l<strong>in</strong>e, so it is wider.) The second plot shows the actual and predicted values from<br />
the sample <strong>to</strong> which the model was fitted, <strong>to</strong>gether with the <strong>for</strong>ecasts and 95% confidence <strong>in</strong>tervals <strong>for</strong> <strong>for</strong>ecasts.<br />
(The latter plot is always produced, even if there are no <strong>for</strong>ecasts.)<br />
<strong>How</strong> <strong>to</strong> generate <strong>for</strong>ecasts “manually”:<br />
enter values <strong>for</strong> the <strong>in</strong>dependent<br />
variables <strong>in</strong> one or more rows at the<br />
right end of the <strong>for</strong>ecast table, below<br />
the variable names, then hit the<br />
Forecast<strong>in</strong>g but<strong>to</strong>n on the <strong>to</strong>olbar.<br />
The <strong>for</strong>ecasts and confidence limits will<br />
be displayed at the left end of the same<br />
row(s), and they will also be plotted.<br />
In the au<strong>to</strong>matic <strong>for</strong>ecast<strong>in</strong>g approach, which is more systematic and more suitable <strong>for</strong> generat<strong>in</strong>g many <strong>for</strong>ecasts<br />
at once, def<strong>in</strong>e your variables up front so that they <strong>in</strong>clude rows <strong>for</strong> out‐of‐sample data from which <strong>for</strong>ecasts are<br />
<strong>to</strong> be computed later. <strong>FSB<strong>for</strong>ecast</strong> will au<strong>to</strong>matically generate <strong>for</strong>ecasts <strong>for</strong> any rows where all of the <strong>in</strong>dependent<br />
variables have values but the dependent variable is miss<strong>in</strong>g (i.e., has a blank cell). The variables must all be<br />
ranges with the same length, but the dependent variable will have some empty cells at the bot<strong>to</strong>m or elsewhere.<br />
The advantage of this approach is that you only need <strong>to</strong> enter the <strong>for</strong>ecast data once, at the time the data file is<br />
first created, and it will au<strong>to</strong>matically be trans<strong>for</strong>med if you apply any data trans<strong>for</strong>mations <strong>to</strong> the same variables<br />
later. Also, when us<strong>in</strong>g this method it is possible <strong>for</strong> <strong>for</strong>ecasts <strong>to</strong> be generated <strong>in</strong> the middle of the data set if<br />
miss<strong>in</strong>g values of the dependent variable happen <strong>to</strong> occur there. The file <strong>use</strong>d <strong>in</strong> the example above conta<strong>in</strong>s an<br />
extra row of data at the bot<strong>to</strong>m <strong>for</strong> a “hypothetical car” whose mileage is <strong>to</strong> be predicted. It has values <strong>for</strong> all the<br />
numeric variables other than MPG_City, so any model fitted <strong>to</strong> MPG_City will generate a <strong>for</strong>ecast <strong>for</strong> this row<br />
au<strong>to</strong>matically, without the need <strong>for</strong> you <strong>to</strong> type values <strong>for</strong> the <strong>in</strong>dependent variables <strong>in</strong> the <strong>for</strong>ecast table. Only<br />
one <strong>for</strong>ecast is shown <strong>in</strong> this example, but you can generate any number of <strong>for</strong>ecasts <strong>in</strong> this way by <strong>in</strong>clud<strong>in</strong>g<br />
8