
You also want an ePaper? Increase the reach of your titles
YUMPU automatically turns print PDFs into web optimized ePapers that Google loves.
Image description.<br />
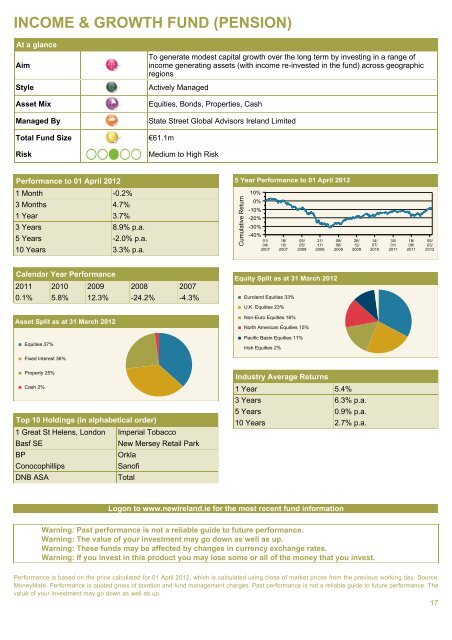
INCOME & GROWTH FUND (PENSION)<br />
At a glance<br />
Aim<br />
Style<br />
Asset Mix<br />
Managed By<br />
Total Fund Size<br />
Risk<br />
To generate modest capital growth over the long term by investing in a range of<br />
income generating assets (with income re-invested in the fund) across geographic<br />
regions<br />
Actively Managed<br />
Equities, Bonds, Properties, Cash<br />
State Street Global Advisors <strong>Ireland</strong> Limited<br />
€61.1m<br />
Medium to High Risk<br />
Performance to 01 April 2012<br />
1 Month -0.2%<br />
3 Months 4.7%<br />
1 Year 3.7%<br />
3 Years 8.9% p.a.<br />
5 Years -2.0% p.a.<br />
10 Years 3.3% p.a.<br />
Image description.<br />
5 Year graph Performance with 1 line to and 01 1828 April 2012<br />
Line 1, Income & Growth Fund S.6. points.<br />
1, 2, 01/04/2007 02/04/2007 3, 03/04/2007 0%.<br />
4, 04/04/2007 0.1%.<br />
5, 05/04/2007 0.4%.<br />
6, 06/04/2007 0.5%.<br />
7, 07/04/2007 8, 08/04/2007 9, 09/04/2007 is 10, 10/04/2007 0.3%.<br />
11, 11/04/2007 0.3%.<br />
12, 12/04/2007 13, 13/04/2007 0.7%.<br />
14, 14/04/2007 0.5%.<br />
15, 15/04/2007 16, 16/04/2007 17, 17/04/2007 0.6%.<br />
18, 18/04/2007 0.9%.<br />
19, 19/04/2007 1.1%.<br />
20, 20/04/2007 0.9%.<br />
21, 21/04/2007 0.6%.<br />
22, 22/04/2007 23, 23/04/2007 24, 24/04/2007 1.2%.<br />
25, 25/04/2007 1.3%.<br />
26, 26/04/2007 0.9%.<br />
27, 27/04/2007 1%.<br />
28, 28/04/2007 1.1%.<br />
29, 29/04/2007 30, 30/04/2007 31, 01/05/2007 0.9%.<br />
32, 02/05/2007 1.1%.<br />
33, 03/05/2007 1.2%.<br />
34, 04/05/2007 1.8%.<br />
35, 05/05/2007 1.9%.<br />
36, 06/05/2007 37, 07/05/2007 38, 08/05/2007 39, 09/05/2007 2.3%.<br />
40, 10/05/2007 2.1%.<br />
41, 11/05/2007 2%.<br />
42, 12/05/2007 1.7%.<br />
43, 13/05/2007 44, 14/05/2007 45, 15/05/2007 1.8%.<br />
46, 16/05/2007 1.7%.<br />
47, 17/05/2007 48, 18/05/2007 1.8%.<br />
49, 19/05/2007 1.9%.<br />
50, 20/05/2007 51, 21/05/2007 52, 22/05/2007 2.3%.<br />
53, 23/05/2007 2.4%.<br />
54, 24/05/2007 2.5%.<br />
55, 25/05/2007 2.7%.<br />
56, 26/05/2007 57, 27/05/2007 58, 28/05/2007 59, 29/05/2007 2.5%.<br />
60, 30/05/2007 2.6%.<br />
61, 31/05/2007 2.5%.<br />
62, 01/06/2007 2.6%.<br />
63, 02/06/2007 2.8%.<br />
64, 03/06/2007 65, 04/06/2007 66, 05/06/2007 67, 06/06/2007 3.2%.<br />
68, 07/06/2007 2.6%.<br />
69, 08/06/2007 2.1%.<br />
70, 09/06/2007 1.4%.<br />
71, 10/06/2007 72, 11/06/2007 73, 12/06/2007 1.5%.<br />
74, 13/06/2007 1.8%.<br />
75, 14/06/2007 1.5%.<br />
76, 15/06/2007 1.6%.<br />
77, 16/06/2007 2.1%.<br />
78, 17/06/2007 79, 18/06/2007 80, 19/06/2007 2.6%.<br />
81, 20/06/2007 82, 21/06/2007 83, 22/06/2007 2.5%.<br />
84, 23/06/2007 2.4%.<br />
85, 24/06/2007 86, 25/06/2007 87, 26/06/2007 2%.<br />
88, 27/06/2007 1.9%.<br />
89, 28/06/2007 1.7%.<br />
90, 29/06/2007 1.6%.<br />
91, 30/06/2007 1.8%.<br />
92, 01/07/2007 93, 02/07/2007 94, 03/07/2007 1.7%.<br />
95, 04/07/2007 1.9%.<br />
96, 05/07/2007 97, 06/07/2007 2.1%.<br />
98, 07/07/2007 1.9%.<br />
99, 08/07/2007 is 100, 09/07/2007 2.3%.<br />
101, 10/07/2007 2.3%.<br />
102, 11/07/2007 2.4%.<br />
103, 12/07/2007 1.9%.<br />
104, 13/07/2007 1.7%.<br />
105, 14/07/2007 2%.<br />
106, 15/07/2007 107, 16/07/2007 108, 17/07/2007 2.2%.<br />
109, 18/07/2007 2.4%.<br />
110, 19/07/2007 2%.<br />
111, 20/07/2007 1.9%.<br />
112, 21/07/2007 2.1%.<br />
113, 22/07/2007 114, 23/07/2007 115, 24/07/2007 1.9%.<br />
116, 25/07/2007 2.2%.<br />
117, 26/07/2007 1.5%.<br />
118, 27/07/2007 1.4%.<br />
119, 28/07/2007 0.1%.<br />
120, 29/07/2007 121, 30/07/2007 122, 31/07/2007 123, 01/08/2007 -0.2%.<br />
124, 02/08/2007 0.4%.<br />
125, 03/08/2007 0.1%.<br />
126, 04/08/2007 0.5%.<br />
127, 05/08/2007 128, 06/08/2007 129, 07/08/2007 130, 08/08/2007 -0.1%.<br />
131, 09/08/2007 0.2%.<br />
132, 10/08/2007 0.9%.<br />
133, 11/08/2007 0.1%.<br />
134, 12/08/2007 135, 13/08/2007 136, 14/08/2007 -1%.<br />
137, 15/08/2007 -0.3%.<br />
138, 16/08/2007 -0.9%.<br />
139, 17/08/2007 -1.2%.<br />
140, 18/08/2007 -2.4%.<br />
141, 19/08/2007 142, 20/08/2007 143, 21/08/2007 -2.1%.<br />
144, 22/08/2007 -1.3%.<br />
145, 23/08/2007 -1.1%.<br />
146, 24/08/2007 147, 25/08/2007 -0.4%.<br />
148, 26/08/2007 149, 27/08/2007 150, 28/08/2007 -0.3%.<br />
151, 29/08/2007 -0.2%.<br />
152, 30/08/2007 -1.1%.<br />
153, 31/08/2007 -0.9%.<br />
154, 01/09/2007 -0.3%.<br />
155, 02/09/2007 156, 03/09/2007 157, 04/09/2007 0.1%.<br />
158, 05/09/2007 0.3%.<br />
159, 06/09/2007 0.4%.<br />
160, 07/09/2007 -0.1%.<br />
161, 08/09/2007 -0.2%.<br />
162, 09/09/2007 163, 10/09/2007 164, 11/09/2007 -0.8%.<br />
165, 12/09/2007 -1.2%.<br />
166, 13/09/2007 167, 14/09/2007 -0.7%.<br />
168, 15/09/2007 -0.5%.<br />
169, 16/09/2007 170, 17/09/2007 171, 18/09/2007 -1.1%.<br />
172, 19/09/2007 -2.2%.<br />
173, 20/09/2007 -1.5%.<br />
174, 21/09/2007 -0.6%.<br />
175, 22/09/2007 -1.1%.<br />
176, 23/09/2007 177, 24/09/2007 178, 25/09/2007 -1%.<br />
179, 26/09/2007 -1.2%.<br />
180, 27/09/2007 -1.6%.<br />
181, 28/09/2007 -1.5%.<br />
182, 29/09/2007 -0.9%.<br />
183, 30/09/2007 184, 01/10/2007 185, 02/10/2007 -0.7%.<br />
186, 03/10/2007 -0.1%.<br />
187, 04/10/2007 0.4%.<br />
188, 05/10/2007 0.5%.<br />
189, 06/10/2007 0.8%.<br />
190, 07/10/2007 191, 08/10/2007 192, 09/10/2007 1.1%.<br />
193, 10/10/2007 1%.<br />
194, 11/10/2007 1.1%.<br />
Point 195, 12/10/2007 is 1%. 0.7%.<br />
5 Year Performance to 01 April 2012<br />
Cumulative Return<br />
10%<br />
0%<br />
-10%<br />
-20%<br />
-30%<br />
-40%<br />
01/<br />
04/<br />
2007<br />
18/<br />
10/<br />
2007<br />
05/<br />
05/<br />
2008<br />
21/<br />
11/<br />
2008<br />
09/<br />
06/<br />
2009<br />
26/<br />
12/<br />
2009<br />
14/<br />
07/<br />
2010<br />
30/<br />
01/<br />
2011<br />
18/<br />
08/<br />
2011<br />
05/<br />
03/<br />
2012<br />
Calendar Year Performance<br />
2011 2010 2009 2008 2007<br />
0.1% 5.8% 12.3% -24.2% -4.3%<br />
Image description.<br />
Equity Pie chart Split with as 6 at items. 31 March 2012<br />
1, 2, Euroland U.K. Equities Equities 23% 33% 23. 33.<br />
3, 4, Non-Euro North American Equities Equities 16% 16.<br />
5, Pacific Basin Equities 11% 15% 11. 15.<br />
Item 6, Irish Equities 2% 2.<br />
End of image description.<br />
Equity Split as at 31 March 2012<br />
Euroland Equities 33%<br />
U.K. Equities 23%<br />
Asset Pie chart Split with as 4 at items. 31 March 2012<br />
1, 2, Equities Fixed Interest 37% 37.<br />
3, Property 25% 36% 25. 36.<br />
Item 4, Cash 2% 2.<br />
End of image description.<br />
Asset Split as at 31 March 2012<br />
Non-Euro Equities 16%<br />
North American Equities 15%<br />
Equities 37%<br />
Pacific Basin Equities 11%<br />
Irish Equities 2%<br />
Fixed Interest 36%<br />
Property 25%<br />
Industry Average Returns<br />
Cash 2%<br />
Top 10 Holdings (in alphabetical order)<br />
1 Great St Helens, London Imperial Tobacco<br />
Basf SE<br />
<strong>New</strong> Mersey Retail Park<br />
BP<br />
Orkla<br />
Conocophillips<br />
Sanofi<br />
DNB ASA<br />
Total<br />
1 Year 5.4%<br />
3 Years 6.3% p.a.<br />
5 Years 0.9% p.a.<br />
10 Years 2.7% p.a.<br />
Logon to www.newireland.ie for the most recent fund information<br />
Warning: Past performance is not a reliable guide to future performance.<br />
Warning: The value of your investment may go down as well as up.<br />
Warning: These funds may be affected by changes in currency exchange rates.<br />
Warning: If you invest in this product you may lose some or all of the money that you invest.<br />
Performance is based on the price calculated for 01 April 2012, which is calculated using close of market prices from the previous working day. Source:<br />
MoneyMate. Performance is quoted gross of taxation and fund management charges. Past performance is not a reliable guide to future performance. The<br />
value of your investment may go down as well as up.<br />
17