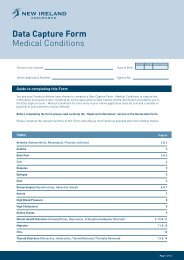
Image description. WATER FUND (PENSION) At a glance Aim Style Asset Mix Managed By Number Of Stocks Total Fund Size Risk To generate long term capital growth by investing in companies in the water sector Actively Managed Equities Kleinwort Benson Investors Dublin (previously known as KBC Asset Management) 46 €7.8m High Risk Performance to 01 April 2012 1 Month 2.0% 3 Months 13.0% 1 Year 10.8% 3 Years 22.3% p.a. 5 Years - 10 Years - Image description. 3 Year graph Performance with 1 line to and 01 1097 April 2012 Line 1, Water Fund (6). points. 1, 2, 01/04/2009 02/04/2009 0%. 3, 03/04/2009 -1.1%. 4, 04/04/2009 3%. 5, 05/04/2009 6, 06/04/2009 7, 07/04/2009 5.8%. 8, 08/04/2009 6.8%. 9, 09/04/2009 is 7%. 10, 10/04/2009 5.8%. 11, 11/04/2009 12, 12/04/2009 13, 13/04/2009 14, 14/04/2009 15, 15/04/2009 6.3%. 16, 16/04/2009 9.6%. 17, 17/04/2009 8.2%. 18, 18/04/2009 9.3%. 19, 19/04/2009 20, 20/04/2009 21, 21/04/2009 11.2%. 22, 22/04/2009 13.3%. 23, 23/04/2009 10.5%. 24, 24/04/2009 11.8%. 25, 25/04/2009 12.1%. 26, 26/04/2009 27, 27/04/2009 28, 28/04/2009 11.4%. 29, 29/04/2009 12.8%. 30, 30/04/2009 13.5%. 31, 01/05/2009 13%. 32, 02/05/2009 14.6%. 33, 03/05/2009 34, 04/05/2009 35, 05/05/2009 36, 06/05/2009 14.7%. 37, 07/05/2009 15.4%. 38, 08/05/2009 18.4%. 39, 09/05/2009 19.6%. 40, 10/05/2009 41, 11/05/2009 42, 12/05/2009 18.2%. 43, 13/05/2009 20.5%. 44, 14/05/2009 17.7%. 45, 15/05/2009 17.5%. 46, 16/05/2009 14.7%. 47, 17/05/2009 48, 18/05/2009 49, 19/05/2009 15.1%. 50, 20/05/2009 15.6%. 51, 21/05/2009 18.4%. 52, 22/05/2009 53, 23/05/2009 54, 24/05/2009 55, 25/05/2009 56, 26/05/2009 19.5%. 57, 27/05/2009 58, 28/05/2009 18.6%. 59, 29/05/2009 16.8%. 60, 30/05/2009 17%. 61, 31/05/2009 62, 01/06/2009 63, 02/06/2009 64, 03/06/2009 16.7%. 65, 04/06/2009 16.1%. 66, 05/06/2009 19.6%. 67, 06/06/2009 18.6%. 68, 07/06/2009 69, 08/06/2009 70, 09/06/2009 19.3%. 71, 10/06/2009 20.2%. 72, 11/06/2009 21.2%. 73, 12/06/2009 74, 13/06/2009 21.9%. 75, 14/06/2009 76, 15/06/2009 77, 16/06/2009 23.5%. 78, 17/06/2009 23.3%. 79, 18/06/2009 21.9%. 80, 19/06/2009 20.2%. 81, 20/06/2009 20.4%. 82, 21/06/2009 83, 22/06/2009 84, 23/06/2009 19.8%. 85, 24/06/2009 20%. 86, 25/06/2009 18.2%. 87, 26/06/2009 16.5%. 88, 27/06/2009 17.9%. 89, 28/06/2009 90, 29/06/2009 91, 30/06/2009 20.5%. 92, 01/07/2009 21.1%. 93, 02/07/2009 22.5%. 94, 03/07/2009 95, 04/07/2009 21.9%. 96, 05/07/2009 97, 06/07/2009 98, 07/07/2009 99, 08/07/2009 is 20.5%. 100, 09/07/2009 19.6%. 101, 10/07/2009 16.7%. 102, 11/07/2009 16.1%. 103, 12/07/2009 104, 13/07/2009 105, 14/07/2009 15.8%. 106, 15/07/2009 107, 16/07/2009 16.1%. 108, 17/07/2009 18.1%. 109, 18/07/2009 20.2%. 110, 19/07/2009 111, 20/07/2009 112, 21/07/2009 21.1%. 113, 22/07/2009 114, 23/07/2009 20.9%. 115, 24/07/2009 21.9%. 116, 25/07/2009 23%. 117, 26/07/2009 118, 27/07/2009 119, 28/07/2009 24%. 120, 29/07/2009 24.7%. 121, 30/07/2009 25.1%. 122, 31/07/2009 25.3%. 123, 01/08/2009 25.6%. 124, 02/08/2009 125, 03/08/2009 126, 04/08/2009 127, 05/08/2009 26.8%. 128, 06/08/2009 26.5%. 129, 07/08/2009 27.2%. 130, 08/08/2009 25.8%. 131, 09/08/2009 132, 10/08/2009 133, 11/08/2009 24.6%. 134, 12/08/2009 26.5%. 135, 13/08/2009 136, 14/08/2009 27.2%. 137, 15/08/2009 27.7%. 138, 16/08/2009 139, 17/08/2009 140, 18/08/2009 27.9%. 141, 19/08/2009 27.2%. 142, 20/08/2009 25.1%. 143, 21/08/2009 144, 22/08/2009 26.7%. 145, 23/08/2009 146, 24/08/2009 147, 25/08/2009 28.1%. 148, 26/08/2009 29.3%. 149, 27/08/2009 29.5%. 150, 28/08/2009 30%. 151, 29/08/2009 152, 30/08/2009 153, 31/08/2009 154, 01/09/2009 31.6%. 155, 02/09/2009 30.2%. 156, 03/09/2009 29.3%. 157, 04/09/2009 28.2%. 158, 05/09/2009 27.7%. 159, 06/09/2009 160, 07/09/2009 161, 08/09/2009 28.1%. 162, 09/09/2009 163, 10/09/2009 29.5%. 164, 11/09/2009 29.8%. 165, 12/09/2009 31.1%. 166, 13/09/2009 167, 14/09/2009 168, 15/09/2009 32.1%. 169, 16/09/2009 170, 17/09/2009 32.3%. 171, 18/09/2009 33.5%. 172, 19/09/2009 34.6%. 173, 20/09/2009 174, 21/09/2009 175, 22/09/2009 34.4%. 176, 23/09/2009 177, 24/09/2009 33.3%. 178, 25/09/2009 31.9%. 179, 26/09/2009 31.2%. 180, 27/09/2009 181, 28/09/2009 182, 29/09/2009 30.4%. 183, 30/09/2009 29.5%. 184, 01/10/2009 31.4%. 185, 02/10/2009 31.8%. 186, 03/10/2009 31.2%. 187, 04/10/2009 188, 05/10/2009 189, 06/10/2009 28.1%. 190, 07/10/2009 26.5%. 191, 08/10/2009 28.2%. 192, 09/10/2009 29.5%. 193, 10/10/2009 29.3%. 194, 11/10/2009 Point 195, 12/10/2009 is 30.5%. 3 Year Performance to 01 April 2012 Cumulative Return 100% 75% 50% 25% 0% -25% 01/ 04/ 2009 10/ 07/ 2009 18/ 10/ 2009 26/ 01/ 2010 06/ 05/ 2010 14/ 08/ 2010 22/ 11/ 2010 02/ 03/ 2011 10/ 06/ 2011 18/ 09/ 2011 27/ 12/ 2011 Calendar Year Performance 2011 2010 2009 2008 2007 -5.6% 23.4% 30.4% -39.5% - Asset Pie chart Split with as 3 at items. 31 March 2012 1, 2, Infrastructure Technologies 42% 32% 42. Item 3, Water/Wastewater Utility 26% 32. 26. End of image description. Asset Split as at 31 March 2012 Water Infrastructure 42% Water Technologies 32% Water/Wastewater Utility 26% Top 10 Holdings (in alphabetical order) Aecom Technology Ebara Elster Group Flowserve Itron Kurita Water Ind. Pentair Severn Trent Suez Environnement United Utilities Logon to www.newireland.ie for the most recent fund information Warning: Past performance is not a reliable guide to future performance. Warning: The value of your investment may go down as well as up. Warning: These funds may be affected by changes in currency exchange rates. Warning: If you invest in this product you may lose some or all of the money that you invest. Performance is based on the price calculated for 01 April 2012, which is calculated using close of market prices from the previous working day. Source: MoneyMate. Performance is quoted gross of taxation and fund management charges. Past performance is not a reliable guide to future performance. The value of your investment may go down as well as up. 30
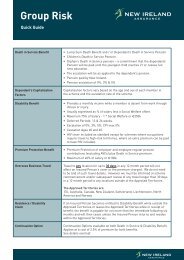
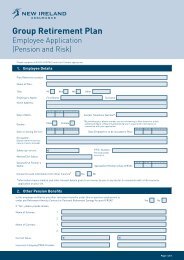
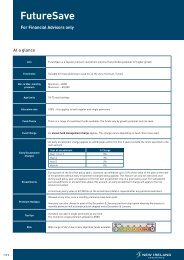
Image description. SPOTLIGHT (PENSION) At a glance Aim Style Asset Mix Managed By Total Fund Size Risk To generate long term capital growth by investing in a portfolio of global equities (approx 15-40) which have been carefully selected by SSgA <strong>Ireland</strong>'s investment team. Actively Managed Equities State Street Global Advisors <strong>Ireland</strong> Limited €8.6m High Risk 1 Month 3 Months 1 Year 3 Years Spotlight S6 2.3% 13.1% 6.0% 20.1% p.a. MSCI The World Index (Net TR) Calendar Year Performance 1.7% 8.8% 7.2% 20.1% p.a. 2011 2010 2009 2008 2007 -7.1% 19.2% 37.6% -32.7% - Image description. Performance Bar chart with versus 4 groups MSCI with The 2 items World per Index group. (Net TR) Y Group scale 1, titled 1 Month. Scale label. Item 1, 2, Spotlight MSCI The S6 World 2.3. Group 2, 3 Months. Index (Net TR) 1.7. Item 1, 2, Spotlight MSCI The S6 World 13.1. Group 3, 1 Year. Index (Net TR) 8.8. Item 1, 2, Spotlight MSCI The S6 World 6. Group 4, 3 Years. Index (Net TR) 7.2. Item 1, 2, Spotlight MSCI The S6 World 20.1. Index (Net TR) 20.1. % End Performance of image description. (p.a.) Performance versus MSCI The World Index (Net TR) % Performance (p.a.) 25 20 15 10 5 0 1 Month 3 Months 1 Year 3 Years Spotlight S6 MSCI The World Index (Net TR) Image description. Geographic Pie chart with Split 7 items. as at 31 March 2012 1, 2, North U.K. Equities American 12% Equities 12. 52% 52. 3, 4, Japanese Euroland Equities 9% 11% 9. 11. 5, 6, Pacific Non-Euro Basin Equities Equities 5% 7% 5. 7. Item 7, Irish Equities 4% 4. End of image description. Geographic Split as at 31 March 2012 Top 10 Holdings (in alphabetical order) Advanced Micro Devices Metlife CRH Microsoft Hanesbrands PNC Financial Services HSBC Shaw Group JP Morgan Chase Western Digital North American Equities 52% U.K. Equities 12% Japanese Equities 11% Euroland Equities 9% Pacific Basin Equities 7% Non-Euro Equities 5% Irish Equities 4% Sector Pie chart Split with as 9 at items. 31 March 2012 1, 2, Financial Technology 21% 18% 21. 3, Industrial 16% 16. 18. 4, 5, Consumer Energy 8% Discretionary 8. 13% 13. 6, 7, Basic Healthcare Materials 7% 7. 8% 8. Item 8, 9, Consumer Utilities 3% Staples 3. 6% 6. End of image description. Sector Split as at 31 March 2012 Financial 21% Technology 18% Industrial 16% Consumer Discretionary 13% Energy 8% Basic Materials 8% Healthcare 7% Consumer Staples 6% Utilities 3% Logon to www.newireland.ie for the most recent fund information Warning: Past performance is not a reliable guide to future performance. Warning: The value of your investment may go down as well as up. Warning: These funds may be affected by changes in currency exchange rates. Warning: If you invest in this product you may lose some or all of the money that you invest. Performance is based on the price calculated for 01 April 2012, which is calculated using close of market prices from the previous working day. Source: MoneyMate. Performance is quoted gross of taxation and fund management charges. Past performance is not a reliable guide to future performance. The value of your investment may go down as well as up. 31