Image description. PENSION PROPERTY FUND At a glance Aim Style Asset Mix Managed By Total Fund Size Risk To generate long term capital growth through a portfolio of prime commercial properties primarily in <strong>Ireland</strong>, the UK and Europe. Actively Managed Property State Street Global Advisors <strong>Ireland</strong> Limited €488.5m High Risk Performance to 01 April 2012 1 Month 0.8% 3 Months 2.0% 1 Year 1.1% 3 Years 3.8% p.a. 5 Years -7.6% p.a. 10 Years 2.1% p.a. Image description. 5 Year graph Performance with 1 line to and 01 1828 April 2012 Line 1, Pension Property Fund (6). points. 1, 2, 01/04/2007 02/04/2007 3, 03/04/2007 0%. 4, 04/04/2007 0.2%. 5, 05/04/2007 0.3%. 6, 06/04/2007 0.2%. 7, 07/04/2007 8, 08/04/2007 9, 09/04/2007 is 10, 10/04/2007 0.1%. 11, 11/04/2007 0.1%. 12, 12/04/2007 13, 13/04/2007 14, 14/04/2007 15, 15/04/2007 16, 16/04/2007 17, 17/04/2007 18, 18/04/2007 0.2%. 19, 19/04/2007 20, 20/04/2007 21, 21/04/2007 0.3%. 22, 22/04/2007 23, 23/04/2007 24, 24/04/2007 0.5%. 25, 25/04/2007 0.6%. 26, 26/04/2007 27, 27/04/2007 28, 28/04/2007 0.5%. 29, 29/04/2007 30, 30/04/2007 31, 01/05/2007 32, 02/05/2007 0.8%. 33, 03/05/2007 0.9%. 34, 04/05/2007 0.7%. 35, 05/05/2007 36, 06/05/2007 37, 07/05/2007 38, 08/05/2007 39, 09/05/2007 0.9%. 40, 10/05/2007 41, 11/05/2007 1%. 42, 12/05/2007 43, 13/05/2007 44, 14/05/2007 45, 15/05/2007 46, 16/05/2007 47, 17/05/2007 48, 18/05/2007 49, 19/05/2007 50, 20/05/2007 51, 21/05/2007 52, 22/05/2007 0.9%. 53, 23/05/2007 1%. 54, 24/05/2007 55, 25/05/2007 56, 26/05/2007 57, 27/05/2007 58, 28/05/2007 59, 29/05/2007 60, 30/05/2007 61, 31/05/2007 62, 01/06/2007 63, 02/06/2007 1.1%. 64, 03/06/2007 65, 04/06/2007 66, 05/06/2007 67, 06/06/2007 68, 07/06/2007 69, 08/06/2007 70, 09/06/2007 71, 10/06/2007 72, 11/06/2007 73, 12/06/2007 1.2%. 74, 13/06/2007 75, 14/06/2007 1.3%. 76, 15/06/2007 1.4%. 77, 16/06/2007 1.3%. 78, 17/06/2007 79, 18/06/2007 80, 19/06/2007 81, 20/06/2007 82, 21/06/2007 83, 22/06/2007 1.4%. 84, 23/06/2007 85, 24/06/2007 86, 25/06/2007 87, 26/06/2007 2.3%. 88, 27/06/2007 2.1%. 89, 28/06/2007 90, 29/06/2007 2.3%. 91, 30/06/2007 2.4%. 92, 01/07/2007 93, 02/07/2007 94, 03/07/2007 95, 04/07/2007 96, 05/07/2007 97, 06/07/2007 1.8%. 98, 07/07/2007 99, 08/07/2007 is 100, 09/07/2007 1.9%. 101, 10/07/2007 1.9%. 102, 11/07/2007 103, 12/07/2007 2%. 104, 13/07/2007 2.1%. 105, 14/07/2007 2%. 106, 15/07/2007 107, 16/07/2007 108, 17/07/2007 109, 18/07/2007 2.1%. 110, 19/07/2007 111, 20/07/2007 112, 21/07/2007 2.2%. 113, 22/07/2007 114, 23/07/2007 115, 24/07/2007 2.3%. 116, 25/07/2007 117, 26/07/2007 2.5%. 118, 27/07/2007 119, 28/07/2007 2.6%. 120, 29/07/2007 121, 30/07/2007 122, 31/07/2007 123, 01/08/2007 124, 02/08/2007 125, 03/08/2007 2.5%. 126, 04/08/2007 2.6%. 127, 05/08/2007 128, 06/08/2007 129, 07/08/2007 130, 08/08/2007 2.5%. 131, 09/08/2007 2.4%. 132, 10/08/2007 133, 11/08/2007 134, 12/08/2007 135, 13/08/2007 136, 14/08/2007 2.5%. 137, 15/08/2007 2.6%. 138, 16/08/2007 2.5%. 139, 17/08/2007 2.6%. 140, 18/08/2007 2%. 141, 19/08/2007 142, 20/08/2007 143, 21/08/2007 1.9%. 144, 22/08/2007 2%. 145, 23/08/2007 2.3%. 146, 24/08/2007 147, 25/08/2007 148, 26/08/2007 149, 27/08/2007 150, 28/08/2007 151, 29/08/2007 152, 30/08/2007 153, 31/08/2007 154, 01/09/2007 155, 02/09/2007 156, 03/09/2007 157, 04/09/2007 158, 05/09/2007 159, 06/09/2007 160, 07/09/2007 161, 08/09/2007 162, 09/09/2007 163, 10/09/2007 164, 11/09/2007 165, 12/09/2007 166, 13/09/2007 167, 14/09/2007 2.4%. 168, 15/09/2007 2.2%. 169, 16/09/2007 170, 17/09/2007 171, 18/09/2007 172, 19/09/2007 173, 20/09/2007 2.1%. 174, 21/09/2007 175, 22/09/2007 176, 23/09/2007 177, 24/09/2007 178, 25/09/2007 2%. 179, 26/09/2007 1.7%. 180, 27/09/2007 1.6%. 181, 28/09/2007 1.5%. 182, 29/09/2007 1.6%. 183, 30/09/2007 184, 01/10/2007 185, 02/10/2007 1.7%. 186, 03/10/2007 1.6%. 187, 04/10/2007 188, 05/10/2007 189, 06/10/2007 190, 07/10/2007 191, 08/10/2007 192, 09/10/2007 193, 10/10/2007 194, 11/10/2007 Point 195, 12/10/2007 is 1.7%. 5 Year Performance to 01 April 2012 Cumulative Return 20% 0% -20% -40% -60% 01/ 04/ 2007 18/ 10/ 2007 05/ 05/ 2008 21/ 11/ 2008 09/ 06/ 2009 26/ 12/ 2009 14/ 07/ 2010 30/ 01/ 2011 18/ 08/ 2011 05/ 03/ 2012 Calendar Year Performance 2011 2010 2009 2008 2007 1.2% 10.6% -7.8% -35.1% -0.4% Asset Pie chart Split with as 6 at items. 31 March 2012 1, 2, U.K. Irish Property (Office) 52% 52. 3, Other 15% 15. 19% 19. 4, 5, Irish Cash Property 3% 3. (Retail) 10% 10. Item 6, Irish Property (Industrial) 1% 1. End of image description. Asset Split as at 31 March 2012 U.K. Property 52% Irish Property (Office) 19% Other Property 15% Irish Property (Retail) 10% Cash 3% Irish Property (Industrial) 1% Top 10 Properties (in alphabetical order) 1 Great St Helens, London Eversheds House - Manchester 15 Dacre Street, London Jodenbreestraat 11-25 15 Grosvenor Street London <strong>New</strong> Mersey Retail Park 27/29 Long Acre, Covent Garden 58 Mosley Street, Manchester Industry Average Returns 1 Year -1.5% 3 Years 4.2% p.a. 5 Years -10.8% p.a. 10 Years 1.2% p.a. Princes Exchange, Leeds SSgA Europe Ex UK Index Real Estate Mutual Fund Logon to www.newireland.ie for the most recent fund information Warning: Past performance is not a reliable guide to future performance. Warning: The value of your investment may go down as well as up. Warning: These funds may be affected by changes in currency exchange rates. Warning: If you invest in this product you may lose some or all of the money that you invest. Performance is based on the price calculated for 01 April 2012, which is calculated using close of market prices from the previous working day.Source: MoneyMate. Performance is quoted gross of taxation and fund management charges. The company reserves the right to restrict encashment or switches in the event of outflows from the fund. Past performance is not a reliable guide to future performance. The value of your investment may go down as well as up. 38
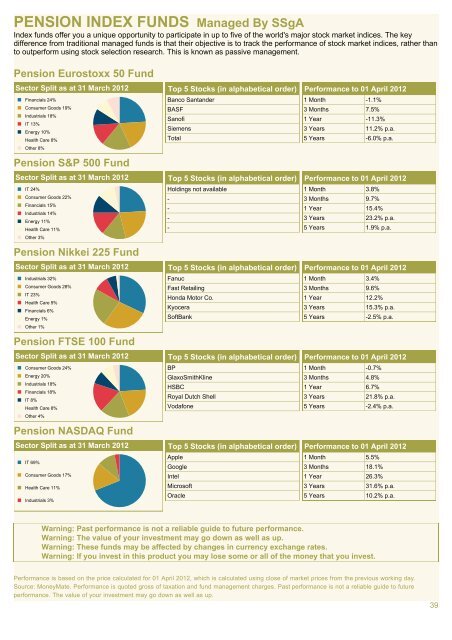
Image description. PENSION INDEX FUNDS Managed By SSgA Index funds offer you a unique opportunity to participate in up to five of the world's major stock market indices. The key difference from traditional managed funds is that their objective is to track the performance of stock market indices, rather than to outperform using stock selection research. This is known as passive management. Pension Eurostoxx 50 Fund Sector Split as at 31 March 2012 Sector Pie chart Split with as 7 at items. 31 March 2012 1, 2, Financials Consumer 24% Goods 24. 3, Industrials 18% 18. 19% 19. 4, 5, IT Energy 13% 10% 13. 6, Health Care 8% 10. Item 7, Other 8% 8. 8. End of image description. Financials 24% Consumer Goods 19% Industrials 18% IT 13% Energy 10% Health Care 8% Other 8% Pension S&P 500 Fund Sector Split as at 31 March 2012 Image description. Sector Pie chart Split with as 7 at items. 31 March 2012 1, 2, IT Consumer 24% 24. 3, Financials 15% Goods 15. 22% 22. 4, 5, Industrials Energy 11% 14% 11. 14. Item 6, 7, Health Other 3% Care 3. 11% 11. End of image description. IT 24% Consumer Goods 22% Financials 15% Industrials 14% Energy 11% Health Care 11% Other 3% Pension Nikkei 225 Fund Sector Split as at 31 March 2012 Image description. Sector Pie chart Split with as 7 at items. 31 March 2012 1, 2, Industrials Consumer 32% Goods 32. 3, IT 23% 23. 28% 28. 4, 5, Health Financials Care 6% 9% 6. 9. Item 6, 7, Energy Other 1% 1% 1. 1. End of image description. Industrials 32% Consumer Goods 28% IT 23% Health Care 9% Financials 6% Energy 1% Other 1% Pension FTSE 100 Fund Sector Split as at 31 March 2012 Image description. Sector Pie chart Split with as 7 at items. 31 March 2012 1, 2, Consumer Energy 20% Goods 20. 24% 24. 3, 4, Industrials Financials 18% 18. 5, 6, IT Health 8% 8. Item 7, Other 4% Care 4. 8% 8. End of image description. Consumer Goods 24% Energy 20% Industrials 18% Financials 18% IT 8% Health Care 8% Other 4% Pension NASDAQ Fund Sector Split as at 31 March 2012 Image description. Sector Pie chart Split with as 4 at items. 31 March 2012 1, 2, IT Consumer 69% 69. 3, Health Care Goods 11% 11. 17% 17. Item 4, Industrials 3% 3. End of image description. IT 69% Consumer Goods 17% Health Care 11% Industrials 3% Top 5 Stocks (in alphabetical order) Banco Santander BASF Sanofi Siemens Total Top 5 Stocks (in alphabetical order) Holdings not available - - - - Top 5 Stocks (in alphabetical order) Fanuc Fast Retailing Honda Motor Co. Kyocera SoftBank Top 5 Stocks (in alphabetical order) BP GlaxoSmithKline HSBC Royal Dutch Shell Vodafone Top 5 Stocks (in alphabetical order) Apple Google Intel Microsoft Oracle Performance to 01 April 2012 1 Month -1.1% 3 Months 7.5% 1 Year -11.3% 3 Years 11.2% p.a. 5 Years -6.0% p.a. Performance to 01 April 2012 1 Month 3.8% 3 Months 9.7% 1 Year 15.4% 3 Years 23.2% p.a. 5 Years 1.9% p.a. Performance to 01 April 2012 1 Month 3.4% 3 Months 9.6% 1 Year 12.2% 3 Years 15.3% p.a. 5 Years -2.5% p.a. Performance to 01 April 2012 1 Month -0.7% 3 Months 4.8% 1 Year 6.7% 3 Years 21.8% p.a. 5 Years -2.4% p.a. Performance to 01 April 2012 1 Month 5.5% 3 Months 18.1% 1 Year 26.3% 3 Years 31.6% p.a. 5 Years 10.2% p.a. Warning: Past performance is not a reliable guide to future performance. Warning: The value of your investment may go down as well as up. Warning: These funds may be affected by changes in currency exchange rates. Warning: If you invest in this product you may lose some or all of the money that you invest. Performance is based on the price calculated for 01 April 2012, which is calculated using close of market prices from the previous working day. Source: MoneyMate. Performance is quoted gross of taxation and fund management charges. Past performance is not a reliable guide to future performance. The value of your investment may go down as well as up. 39