Create successful ePaper yourself
Turn your PDF publications into a flip-book with our unique Google optimized e-Paper software.
Image description.<br />
BLOXHAM DEFENSIVE HIGH YIELD FUND (PENSION)<br />
At a glance<br />
Aim<br />
Style<br />
Asset Mix<br />
Managed By<br />
Number Of<br />
Stocks<br />
Total Fund Size<br />
Risk<br />
To generate long term capital growth with a relatively high, yet sustainable, flow of<br />
dividend income for the fund with the potential to increase over time<br />
An actively managed equity fund that employs a strict risk management strategy with<br />
the aim of reducing risk<br />
High Yield Global Equities (Shares that typically pay an above average dividend<br />
yield)<br />
Bloxham<br />
39<br />
€13.2m<br />
Medium to High Risk<br />
Bloxham Defensive<br />
HY S6 R<br />
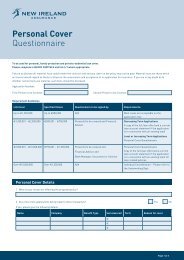
Sector Pie chart Split with as 10 at items. 31 March 2012<br />
1, 2, Financials Consumer 19% Staples 19.<br />
3, Industrials 13% 13. 17% 17.<br />
4, 5, Technology Healthcare 10% 10% 10. 10.<br />
6, 7, Energy Materials 10% 8% 10.<br />
8, Consumer Discretionary 8.<br />
9, Communications 3% 3. 7% 7.<br />
Item 10, Utilities 3% 3.<br />
End of image description.<br />
1<br />
Month<br />
3<br />
Months<br />
1<br />
Year<br />
0.4% 3.4% - -<br />
3 Years<br />
FTSE World Index 1.1% 8.5% 3.7% 17.9%<br />
p.a.<br />
Calendar Year Performance<br />
2011 2010 2009 2008 2007<br />
- - - - -<br />
Top 10 Holdings (in alphabetical order)<br />
3M<br />
Abbott Lab<br />
Canon Inc<br />
General Mills<br />
Petrochina<br />
Sector Split as at 31 March 2012<br />
Financials 19%<br />
Consumer Staples 17%<br />
Industrials 13%<br />
Technology 10%<br />
Healthcare 10%<br />
Energy 10%<br />
Materials 8%<br />
Consumer Discretionary 7%<br />
Communications 3%<br />
Utilities 3%<br />
Royal Dutch Shell<br />
Syngenta<br />
Teliasonera<br />
Toronto-Dominion<br />
Unilever<br />
Image description.<br />
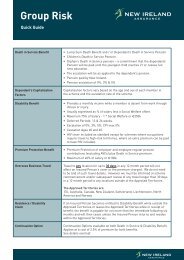
Performance Bar chart with versus 4 groups FTSE with World 2 items Index<br />
Y scale titled Scale label.<br />
per group.<br />
Group 1, 1, Bloxham 1 Month.<br />
Item 2, FTSE World Defensive Index 1.1. HY S6 R 0.4.<br />
Group 1, 2, Bloxham 3 Months.<br />
Item 2, FTSE World Defensive Index 8.5. HY S6 R 3.4.<br />
Group 1, 3, Bloxham 1 Year.<br />
Item 2, FTSE World Defensive Index 3.7. HY S6 R No data.<br />
Group 1, 4, Bloxham 3 Years.<br />
Item 2, FTSE World Defensive Index 17.9. HY S6 R No data.<br />
% End Performance of image description. (p.a.)<br />
Performance versus FTSE World Index<br />
% Performance (p.a.)<br />
20<br />
15<br />
10<br />
5<br />
0<br />
1 Month 3 Months 1 Year 3 Years<br />
Bloxham Defensive HY S6 R<br />
FTSE World Index<br />
5 Best Performing Equities (Over 1 Month)<br />
Performance Contribution to Fund<br />
Staples 11.4% 0.29%<br />
Abbott Lab 8.5% 0.21%<br />
M&T Bank 7.3% 0.19%<br />
Coca Cola 6.9% 0.17%<br />
Syngenta 5.9% 0.15%<br />
Image description.<br />
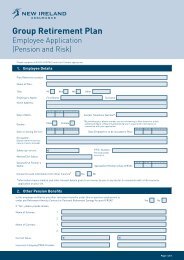
Geographic Pie chart with Split 4 items. as at 31 March 2012<br />
1, 2, North European American Equities Equities 20% 20. 49% 49.<br />
Item 3, 4, Pacific U.K. Equities Basin 18% 13% 18. 13.<br />
End of image description.<br />
Geographic Split as at 31 March 2012<br />
North American Equities 49%<br />
European Equities 20%<br />
Pacific Basin 18%<br />
U.K. Equities 13%<br />
Logon to www.newireland.ie for the most recent fund information<br />
Warning: Past performance is not a reliable guide to future performance.<br />
Warning: The value of your investment may go down as well as up.<br />
Warning: These funds may be affected by changes in currency exchange rates.<br />
Warning: If you invest in this product you may lose some or all of the money that you invest.<br />
Performance is based on the price calculated for 01 April 2012, which is calculated using close of market prices from the previous working day. Source:<br />
MoneyMate. Performance is quoted gross of taxation and fund management charges. Past performance is not a reliable guide to future performance. The<br />
value of your investment may go down as well as up.<br />
24