
You also want an ePaper? Increase the reach of your titles
YUMPU automatically turns print PDFs into web optimized ePapers that Google loves.
Image description.<br />
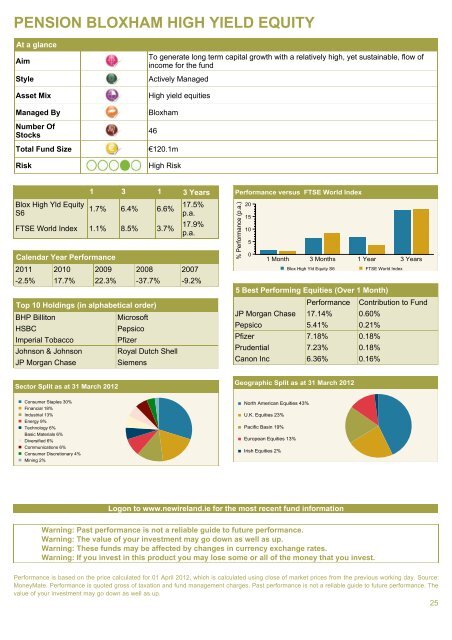
PENSION BLOXHAM HIGH YIELD EQUITY<br />
At a glance<br />
Aim<br />
Style<br />
Asset Mix<br />
Managed By<br />
Number Of<br />
Stocks<br />
Total Fund Size<br />
Risk<br />
To generate long term capital growth with a relatively high, yet sustainable, flow of<br />
income for the fund<br />
Actively Managed<br />
High yield equities<br />
Bloxham<br />
46<br />
€120.1m<br />
High Risk<br />
Blox High Yld Equity<br />
S6<br />
1 3 1 3 Years<br />
1.7% 6.4% 6.6% 17.5%<br />
p.a.<br />
FTSE World Index 1.1% 8.5% 3.7% 17.9%<br />
p.a.<br />
Calendar Year Performance<br />
2011 2010 2009 2008 2007<br />
-2.5% 17.7% 22.3% -37.7% -9.2%<br />
Top 10 Holdings (in alphabetical order)<br />
BHP Billiton<br />
HSBC<br />
Imperial Tobacco<br />
Johnson & Johnson<br />
JP Morgan Chase<br />
Microsoft<br />
Pepsico<br />
Pfizer<br />
Royal Dutch Shell<br />
Siemens<br />
Image description.<br />
Performance Bar chart with versus 4 groups FTSE with World 2 items Index<br />
Y scale titled Scale label.<br />
per group.<br />
Group 1, 1, Blox 1 Month.<br />
Item 2, FTSE High World Yld Index Equity 1.1. S6 1.7.<br />
Group 1, 2, Blox 3 Months.<br />
Item 2, FTSE High World Yld Index Equity 8.5. S6 6.4.<br />
Group 1, 3, Blox 1 Year.<br />
Item 2, FTSE High World Yld Index Equity 3.7. S6 6.6.<br />
Group 1, 4, Blox 3 Years.<br />
Item 2, FTSE High World Yld Index Equity 17.9. S6 17.5.<br />
% End Performance of image description. (p.a.)<br />
Performance versus FTSE World Index<br />
% Performance (p.a.)<br />
20<br />
15<br />
10<br />
5<br />
0<br />
1 Month 3 Months 1 Year 3 Years<br />
Blox High Yld Equity S6<br />
FTSE World Index<br />
5 Best Performing Equities (Over 1 Month)<br />
Performance Contribution to Fund<br />
JP Morgan Chase 17.14% 0.60%<br />
Pepsico 5.41% 0.21%<br />
Pfizer 7.18% 0.18%<br />
Prudential 7.23% 0.18%<br />
Canon Inc 6.36% 0.16%<br />
Sector Pie chart Split with as 10 at items. 31 March 2012<br />
1, 2, Consumer Financial 18% Staples 18. 30% 30.<br />
3, 4, Industrial Energy 9% 13% 9. 13.<br />
5, 6, Technology Basic Materials 6% 6% 6.<br />
7, Diversified 6% 6. 6.<br />
8, 9, Communications Consumer Discretionary 6% 6.<br />
Item 10, Mining 2% 2. 4% 4.<br />
End of image description.<br />
Sector Split as at 31 March 2012<br />
Image description.<br />
Geographic Pie chart with Split 5 items. as at 31 March 2012<br />
1, 2, North U.K. Equities American 23% Equities 23. 43% 43.<br />
3, 4, Pacific European Basin Equities 19% 19.<br />
Item 5, Irish Equities 2% 2. 13% 13.<br />
End of image description.<br />
Geographic Split as at 31 March 2012<br />
Consumer Staples 30%<br />
Financial 18%<br />
Industrial 13%<br />
Energy 9%<br />
Technology 6%<br />
Basic Materials 6%<br />
Diversified 6%<br />
Communications 6%<br />
Consumer Discretionary 4%<br />
Mining 2%<br />
North American Equities 43%<br />
U.K. Equities 23%<br />
Pacific Basin 19%<br />
European Equities 13%<br />
Irish Equities 2%<br />
Logon to www.newireland.ie for the most recent fund information<br />
Warning: Past performance is not a reliable guide to future performance.<br />
Warning: The value of your investment may go down as well as up.<br />
Warning: These funds may be affected by changes in currency exchange rates.<br />
Warning: If you invest in this product you may lose some or all of the money that you invest.<br />
Performance is based on the price calculated for 01 April 2012, which is calculated using close of market prices from the previous working day. Source:<br />
MoneyMate. Performance is quoted gross of taxation and fund management charges. Past performance is not a reliable guide to future performance. The<br />
value of your investment may go down as well as up.<br />
25