- Page 1: FINAL Salt Lake City International
- Page 6 and 7: Executive Summary This Environmenta
- Page 8 and 9: EXECUTIVE SUMMARY Proposed Action T
- Page 10 and 11: EXECUTIVE SUMMARY Additional facili
- Page 12 and 13: B 215 D A C E C 80 F Airport Bounda
- Page 14 and 15: Existing 1975 Terminal Area Plan 19
- Page 16 and 17: EXECUTIVE SUMMARY meet purpose and
- Page 18 and 19: EXECUTIVE SUMMARY TABLE ES-2 Compar
- Page 20 and 21: W 2670 N 2200 32 00 W 2100 N 16 R 1
- Page 22 and 23: EXECUTIVE SUMMARY contamination, as
- Page 24 and 25: EXECUTIVE SUMMARY aircraft flying i
- Page 26 and 27: Contents, Continued Page 4 Affected
- Page 28 and 29: Contents, Continued Page 5.15 Socia
- Page 30 and 31: Contents, Continued Page Exhibits 1
- Page 32 and 33: ACRONYMS AND ABBREVIATIONS I-15 Int
- Page 34 and 35: CHAPTER 1 Purpose and Need Paragrap
- Page 36 and 37: Existing terminal complex is 50 yea
- Page 38 and 39: $16,000,000 $14,000,000 $12,000,000
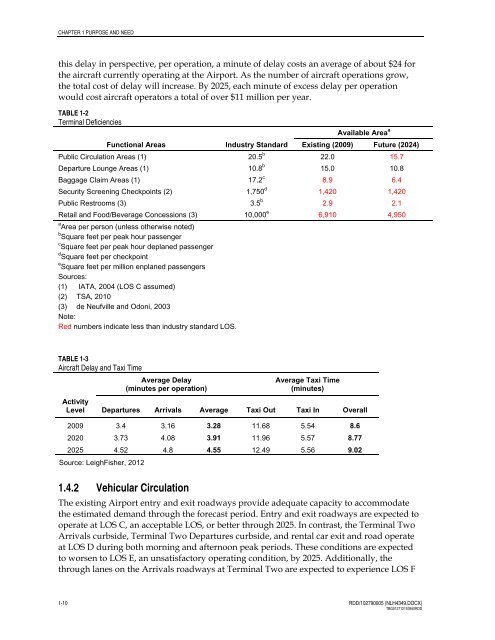
- Page 40 and 41: CHAPTER 1 PURPOSE AND NEED terminal
- Page 44 and 45: CHAPTER 1 PURPOSE AND NEED conditio
- Page 46 and 47: 18 16 14 En nplaned Pass sengers (m
- Page 48 and 49: CHAPTER 2 Proposed Action This chap
- Page 50 and 51: CHAPTER 2 PROPOSED ACTION 2.1.1 Air
- Page 52 and 53: CHAPTER 2 PROPOSED ACTION provide s
- Page 54 and 55: CHAPTER 2 PROPOSED ACTION The Propo
- Page 56 and 57: Source: HNTB AutoCAD drawings, Janu
- Page 58 and 59: CHAPTER 3 ALTERNATIVES terminal sit
- Page 60 and 61: CHAPTER 3 ALTERNATIVES 3.1.1.2 Conc
- Page 62 and 63: CHAPTER 3 ALTERNATIVES The concepts
- Page 64 and 65: CHAPTER 3 ALTERNATIVES 3.1.2 Other
- Page 66 and 67: CHAPTER 3 ALTERNATIVES 3.1.3.1 Repl
- Page 68 and 69: CHAPTER 3 ALTERNATIVES consideratio
- Page 70 and 71: CHAPTER 3 ALTERNATIVES the mix of g
- Page 72 and 73: CHAPTER 3 ALTERNATIVES 74 gates, or
- Page 74 and 75: CHAPTER 3 ALTERNATIVES TABLE 3-2 Co
- Page 76 and 77: 16 R 16 L 17 14 HAROLD GATTY DR WRI
- Page 78 and 79: CHAPTER 4 AFFECTED ENVIRONMENT SLC
- Page 80 and 81: CHAPTER 4 AFFECTED ENVIRONMENT 4.2.
- Page 82 and 83: CHAPTER 4 AFFECTED ENVIRONMENT TABL
- Page 84 and 85: CHAPTER 4 AFFECTED ENVIRONMENT 4.3.
- Page 86 and 87: CHAPTER 4 AFFECTED ENVIRONMENT TABL
- Page 88 and 89: CHAPTER 4 AFFECTED ENVIRONMENT 4.3.
- Page 90 and 91: 20 B2 B18 A1 A A14 C C19 D E D23 E
- Page 92 and 93:
CHAPTER 4 AFFECTED ENVIRONMENT cour
- Page 94 and 95:
CHAPTER 5 Environmental Consequence
- Page 96 and 97:
CHAPTER 5 ENVIRONMENTAL CONSEQUENCE
- Page 98 and 99:
CHAPTER 5 ENVIRONMENTAL CONSEQUENCE
- Page 100 and 101:
CHAPTER 5 ENVIRONMENTAL CONSEQUENCE
- Page 102 and 103:
CHAPTER 5 ENVIRONMENTAL CONSEQUENCE
- Page 104 and 105:
CHAPTER 5 ENVIRONMENTAL CONSEQUENCE
- Page 106 and 107:
CHAPTER 5 ENVIRONMENTAL CONSEQUENCE
- Page 108 and 109:
CHAPTER 5 ENVIRONMENTAL CONSEQUENCE
- Page 110 and 111:
West Drainage Area 17 ! 003A East D
- Page 112 and 113:
CHAPTER 5 ENVIRONMENTAL CONSEQUENCE
- Page 114 and 115:
¹ 0 500 3,000 Feet Imagery taken f
- Page 116 and 117:
CHAPTER 5 ENVIRONMENTAL CONSEQUENCE
- Page 118 and 119:
CHAPTER 5 ENVIRONMENTAL CONSEQUENCE
- Page 120 and 121:
CHAPTER 5 ENVIRONMENTAL CONSEQUENCE
- Page 122 and 123:
CHAPTER 5 ENVIRONMENTAL CONSEQUENCE
- Page 124 and 125:
CHAPTER 5 ENVIRONMENTAL CONSEQUENCE
- Page 126 and 127:
CHAPTER 5 ENVIRONMENTAL CONSEQUENCE
- Page 128 and 129:
CHAPTER 5 ENVIRONMENTAL CONSEQUENCE
- Page 130 and 131:
CHAPTER 5 ENVIRONMENTAL CONSEQUENCE
- Page 132 and 133:
CHAPTER 5 ENVIRONMENTAL CONSEQUENCE
- Page 134 and 135:
CHAPTER 5 ENVIRONMENTAL CONSEQUENCE
- Page 136 and 137:
CHAPTER 5 ENVIRONMENTAL CONSEQUENCE
- Page 138 and 139:
CHAPTER 5 ENVIRONMENTAL CONSEQUENCE
- Page 140 and 141:
CHAPTER 5 ENVIRONMENTAL CONSEQUENCE
- Page 142 and 143:
CHAPTER 5 ENVIRONMENTAL CONSEQUENCE
- Page 144 and 145:
CHAPTER 5 ENVIRONMENTAL CONSEQUENCE
- Page 146 and 147:
CHAPTER 5 ENVIRONMENTAL CONSEQUENCE
- Page 148 and 149:
CHAPTER 6 AGENCY AND PUBLIC INVOLVE
- Page 150 and 151:
CHAPTER 6 AGENCY AND PUBLIC INVOLVE
- Page 152 and 153:
CHAPTER 8 References Allison, J.R.,
- Page 154 and 155:
CHAPTER 8 REFERENCES Salt Lake City
- Page 156 and 157:
Appendix A Technical Memorandum: Av
- Page 158 and 159:
Contents Page 1.0 Introduction and
- Page 160 and 161:
Tables Page 1 Salt Lake City CMSA P
- Page 162 and 163:
AVIATION DEMAND FORECASTS future fl
- Page 164 and 165:
AVIATION DEMAND FORECASTS 1.4 Aircr
- Page 166 and 167:
AVIATION DEMAND FORECASTS Salt Lake
- Page 168 and 169:
AVIATION DEMAND FORECASTS Table 2 U
- Page 170 and 171:
AVIATION DEMAND FORECASTS 2.0 Econo
- Page 172 and 173:
AVIATION DEMAND FORECASTS 2.1.2 Emp
- Page 174 and 175:
AVIATION DEMAND FORECASTS Table 4 H
- Page 176 and 177:
AVIATION DEMAND FORECASTS TABLE 5 M
- Page 178 and 179:
AVIATION DEMAND FORECASTS During th
- Page 180 and 181:
AVIATION DEMAND FORECASTS 2.2.2 Uta
- Page 182 and 183:
AVIATION DEMAND FORECASTS Table 7 S
- Page 184 and 185:
AVIATION DEMAND FORECASTS 3.0 Histo
- Page 186 and 187:
AVIATION DEMAND FORECASTS TABLE 9 H
- Page 188 and 189:
AVIATION DEMAND FORECASTS 9 Histori
- Page 190 and 191:
AVIATION DEMAND FORECASTS Since 200
- Page 192 and 193:
AVIATION DEMAND FORECASTS 3.3.2 Ori
- Page 194 and 195:
AVIATION DEMAND FORECASTS Table 12
- Page 196 and 197:
AVIATION DEMAND FORECASTS Table 13
- Page 198 and 199:
AVIATION DEMAND FORECASTS Table 14
- Page 200 and 201:
AVIATION DEMAND FORECASTS An incr
- Page 202 and 203:
AVIATION DEMAND FORECASTS Table 16
- Page 204 and 205:
AVIATION DEMAND FORECASTS Table 17
- Page 206 and 207:
AVIATION DEMAND FORECASTS historica
- Page 208 and 209:
AVIATION DEMAND FORECASTS system or
- Page 210 and 211:
AVIATION DEMAND FORECASTS Table 18
- Page 212 and 213:
AVIATION DEMAND FORECASTS 18 Histor
- Page 214 and 215:
AVIATION DEMAND FORECASTS Figure 20
- Page 216 and 217:
AVIATION DEMAND FORECASTS 5.2.4 All
- Page 218 and 219:
AVIATION DEMAND FORECASTS 22 Histor
- Page 220 and 221:
AVIATION DEMAND FORECASTS Table 20
- Page 222 and 223:
AVIATION DEMAND FORECASTS Passenger
- Page 224 and 225:
AVIATION DEMAND FORECASTS Table 22
- Page 226 and 227:
AVIATION DEMAND FORECASTS 6.0 Compa
- Page 228 and 229:
AVIATION DEMAND FORECASTS Table 24
- Page 230 and 231:
AVIATION DEMAND FORECASTS Table A-1
- Page 232 and 233:
AVIATION DEMAND FORECASTS on the fo
- Page 234 and 235:
AVIATION DEMAND FORECASTS Departure
- Page 236 and 237:
Table B-2 Forecasts of Average Annu
- Page 238 and 239:
Table B-3 Average Annual Day Aircra
- Page 240 and 241:
Table B-4 Average Annual Day Aircra
- Page 242 and 243:
Table B-5 Average Annual Day Aircra
- Page 244 and 245:
Table B-6 Active Aircraft Fleets by
- Page 246 and 247:
Table B-6 (page 3 of 7) Active Airc
- Page 248 and 249:
Table B-6 (page 5 of 7) Active Airc
- Page 250 and 251:
Table B-6 (page 7 of 7) Active Airc
- Page 252 and 253:
Aviation + Transportation SLC Termi
- Page 254 and 255:
PROJECT UPDATE SALT LAKE CITY INTER
- Page 256 and 257:
PROJECT UPDATE SALT LAKE CITY INTER
- Page 258 and 259:
PROJECT UPDATE SALT LAKE CITY INTER
- Page 260 and 261:
PROJECT UPDATE SALT LAKE CITY INTER
- Page 262 and 263:
PROJECT UPDATE SALT LAKE CITY INTER
- Page 264 and 265:
PROJECT UPDATE SALT LAKE CITY INTER
- Page 266 and 267:
PROJECT UPDATE SALT LAKE CITY INTER
- Page 268 and 269:
PROJECT UPDATE SALT LAKE CITY INTER
- Page 270 and 271:
PROJECT UPDATE SALT LAKE CITY INTER
- Page 272 and 273:
Appendix C Environmental Data Resou
- Page 274 and 275:
TABLE OF CONTENTS SECTION PAGE Exec
- Page 276 and 277:
EXECUTIVE SUMMARY Federal CERCLIS l
- Page 278 and 279:
EXECUTIVE SUMMARY CERCLIS: The Comp
- Page 280 and 281:
EXECUTIVE SUMMARY RCRA-CESQG: RCRAI
- Page 282 and 283:
EXECUTIVE SUMMARY _________________
- Page 284 and 285:
EXECUTIVE SUMMARY _________________
- Page 286 and 287:
EXECUTIVE SUMMARY _________________
- Page 288 and 289:
EXECUTIVE SUMMARY TRIS: The Toxic C
- Page 290 and 291:
EXECUTIVE SUMMARY _________________
- Page 292 and 293:
EXECUTIVE SUMMARY _________________
- Page 294 and 295:
EDR Inc. 138 kV 138 kV 138 kV 138 k
- Page 296 and 297:
MAP FINDINGS SUMMARY Search Target
- Page 298 and 299:
MAP FINDINGS SUMMARY Search Target
- Page 300 and 301:
Map ID Direction Distance Elevation
- Page 302 and 303:
Map ID Direction Distance Elevation
- Page 304 and 305:
Map ID Direction Distance Elevation
- Page 306 and 307:
Map ID Direction Distance Elevation
- Page 308 and 309:
Map ID Direction Distance Elevation
- Page 310 and 311:
Map ID Direction Distance Elevation
- Page 312 and 313:
Map ID Direction Distance Elevation
- Page 314 and 315:
Map ID Direction Distance Elevation
- Page 316 and 317:
Map ID Direction Distance Elevation
- Page 318 and 319:
Map ID Direction Distance Elevation
- Page 320 and 321:
Map ID Direction Distance Elevation
- Page 322 and 323:
Map ID Direction Distance Elevation
- Page 324 and 325:
Map ID Direction Distance Elevation
- Page 326 and 327:
Map ID Direction Distance Elevation
- Page 328 and 329:
Map ID Direction Distance Elevation
- Page 330 and 331:
Map ID Direction Distance Elevation
- Page 332 and 333:
Map ID Direction Distance Elevation
- Page 334 and 335:
Map ID Direction Distance Elevation
- Page 336 and 337:
Map ID Direction Distance Elevation
- Page 338 and 339:
Map ID Direction Distance Elevation
- Page 340 and 341:
Map ID Direction Distance Elevation
- Page 342 and 343:
Map ID Direction Distance Elevation
- Page 344 and 345:
Map ID Direction Distance Elevation
- Page 346 and 347:
Map ID Direction Distance Elevation
- Page 348 and 349:
Map ID Direction Distance Elevation
- Page 350 and 351:
Map ID Direction Distance Elevation
- Page 352 and 353:
Map ID Direction Distance Elevation
- Page 354 and 355:
Map ID Direction Distance Elevation
- Page 356 and 357:
Map ID Direction Distance Elevation
- Page 358 and 359:
Map ID Direction Distance Elevation
- Page 360 and 361:
Map ID Direction Distance Elevation
- Page 362 and 363:
Map ID Direction Distance Elevation
- Page 364 and 365:
Map ID Direction Distance Elevation
- Page 366 and 367:
Map ID Direction Distance Elevation
- Page 368 and 369:
Map ID Direction Distance Elevation
- Page 370 and 371:
Map ID Direction Distance Elevation
- Page 372 and 373:
Map ID Direction Distance Elevation
- Page 374 and 375:
Map ID Direction Distance Elevation
- Page 376 and 377:
Map ID Direction Distance Elevation
- Page 378 and 379:
Map ID Direction Distance Elevation
- Page 380 and 381:
Map ID Direction Distance Elevation
- Page 382 and 383:
Map ID Direction Distance Elevation
- Page 384 and 385:
Map ID Direction Distance Elevation
- Page 386 and 387:
Map ID Direction Distance Elevation
- Page 388 and 389:
Map ID Direction Distance Elevation
- Page 390 and 391:
Map ID Direction Distance Elevation
- Page 392 and 393:
Map ID Direction Distance Elevation
- Page 394 and 395:
Map ID Direction Distance Elevation
- Page 396 and 397:
Map ID Direction Distance Elevation
- Page 398 and 399:
Map ID Direction Distance Elevation
- Page 400 and 401:
Map ID Direction Distance Elevation
- Page 402 and 403:
Map ID Direction Distance Elevation
- Page 404 and 405:
Map ID Direction Distance Elevation
- Page 406 and 407:
Map ID Direction Distance Elevation
- Page 408 and 409:
Map ID Direction Distance Elevation
- Page 410 and 411:
Map ID Direction Distance Elevation
- Page 412 and 413:
Map ID Direction Distance Elevation
- Page 414 and 415:
Map ID Direction Distance Elevation
- Page 416 and 417:
Map ID Direction Distance Elevation
- Page 418 and 419:
Map ID Direction Distance Elevation
- Page 420 and 421:
Map ID Direction Distance Elevation
- Page 422 and 423:
Map ID Direction Distance Elevation
- Page 424 and 425:
Map ID Direction Distance Elevation
- Page 426 and 427:
Map ID Direction Distance Elevation
- Page 428 and 429:
Map ID Direction Distance Elevation
- Page 430 and 431:
Map ID Direction Distance Elevation
- Page 432 and 433:
Map ID Direction Distance Elevation
- Page 434 and 435:
Map ID Direction Distance Elevation
- Page 436 and 437:
Map ID Direction Distance Elevation
- Page 438 and 439:
Map ID Direction Distance Elevation
- Page 440 and 441:
Map ID Direction Distance Elevation
- Page 442 and 443:
Map ID Direction Distance Elevation
- Page 444 and 445:
Map ID Direction Distance Elevation
- Page 446 and 447:
Map ID Direction Distance Elevation
- Page 448 and 449:
Map ID Direction Distance Elevation
- Page 450 and 451:
Map ID Direction Distance Elevation
- Page 452 and 453:
Map ID Direction Distance Elevation
- Page 454 and 455:
Map ID Direction Distance Elevation
- Page 456 and 457:
Map ID Direction Distance Elevation
- Page 458 and 459:
Map ID Direction Distance Elevation
- Page 460 and 461:
Map ID Direction Distance Elevation
- Page 462 and 463:
Map ID Direction Distance Elevation
- Page 464 and 465:
Map ID Direction Distance Elevation
- Page 466 and 467:
Map ID Direction Distance Elevation
- Page 468 and 469:
Map ID Direction Distance Elevation
- Page 470 and 471:
Map ID Direction Distance Elevation
- Page 472 and 473:
Map ID Direction Distance Elevation
- Page 474 and 475:
Map ID Direction Distance Elevation
- Page 476 and 477:
Map ID Direction Distance Elevation
- Page 478 and 479:
Map ID Direction Distance Elevation
- Page 480 and 481:
Map ID Direction Distance Elevation
- Page 482 and 483:
Map ID Direction Distance Elevation
- Page 484 and 485:
Map ID Direction Distance Elevation
- Page 486 and 487:
Map ID Direction Distance Elevation
- Page 488 and 489:
Map ID Direction Distance Elevation
- Page 490 and 491:
Map ID Direction Distance Elevation
- Page 492 and 493:
Map ID Direction Distance Elevation
- Page 494 and 495:
Map ID Direction Distance Elevation
- Page 496 and 497:
Map ID Direction Distance Elevation
- Page 498 and 499:
Map ID Direction Distance Elevation
- Page 500 and 501:
Map ID Direction Distance Elevation
- Page 502 and 503:
Map ID Direction Distance Elevation
- Page 504 and 505:
Map ID Direction Distance Elevation
- Page 506 and 507:
Map ID Direction Distance Elevation
- Page 508 and 509:
Map ID Direction Distance Elevation
- Page 510 and 511:
Map ID Direction Distance Elevation
- Page 512 and 513:
Map ID Direction Distance Elevation
- Page 514 and 515:
Map ID Direction Distance Elevation
- Page 516 and 517:
Map ID Direction Distance Elevation
- Page 518 and 519:
Map ID Direction Distance Elevation
- Page 520 and 521:
Map ID Direction Distance Elevation
- Page 522 and 523:
Map ID Direction Distance Elevation
- Page 524 and 525:
Map ID Direction Distance Elevation
- Page 526 and 527:
Map ID Direction Distance Elevation
- Page 528 and 529:
Map ID Direction Distance Elevation
- Page 530 and 531:
Map ID Direction Distance Elevation
- Page 532 and 533:
Map ID Direction Distance Elevation
- Page 534 and 535:
Map ID Direction Distance Elevation
- Page 536 and 537:
Map ID Direction Distance Elevation
- Page 538 and 539:
Map ID Direction Distance Elevation
- Page 540 and 541:
Map ID Direction Distance Elevation
- Page 542 and 543:
Map ID Direction Distance Elevation
- Page 544 and 545:
Map ID Direction Distance Elevation
- Page 546 and 547:
Map ID Direction Distance Elevation
- Page 548 and 549:
Map ID Direction Distance Elevation
- Page 550 and 551:
Map ID Direction Distance Elevation
- Page 552 and 553:
Map ID Direction Distance Elevation
- Page 554 and 555:
Map ID Direction Distance Elevation
- Page 556 and 557:
Map ID Direction Distance Elevation
- Page 558 and 559:
Map ID Direction Distance Elevation
- Page 560 and 561:
Map ID Direction Distance Elevation
- Page 562 and 563:
Map ID Direction Distance Elevation
- Page 564 and 565:
Map ID Direction Distance Elevation
- Page 566 and 567:
Map ID Direction Distance Elevation
- Page 568 and 569:
Map ID Direction Distance Elevation
- Page 570 and 571:
Map ID Direction Distance Elevation
- Page 572 and 573:
Map ID Direction Distance Elevation
- Page 574 and 575:
Map ID Direction Distance Elevation
- Page 576 and 577:
Map ID Direction Distance Elevation
- Page 578 and 579:
Map ID Direction Distance Elevation
- Page 580 and 581:
Map ID Direction Distance Elevation
- Page 582 and 583:
Map ID Direction Distance Elevation
- Page 584 and 585:
Map ID Direction Distance Elevation
- Page 586 and 587:
Map ID Direction Distance Elevation
- Page 588 and 589:
Map ID Direction Distance Elevation
- Page 590 and 591:
Map ID Direction Distance Elevation
- Page 592 and 593:
Map ID Direction Distance Elevation
- Page 594 and 595:
Map ID Direction Distance Elevation
- Page 596 and 597:
Map ID Direction Distance Elevation
- Page 598 and 599:
Map ID Direction Distance Elevation
- Page 600 and 601:
Map ID Direction Distance Elevation
- Page 602 and 603:
ORPHAN SUMMARY City EDR ID Site Nam
- Page 604 and 605:
GOVERNMENT RECORDS SEARCHED / DATA
- Page 606 and 607:
GOVERNMENT RECORDS SEARCHED / DATA
- Page 608 and 609:
GOVERNMENT RECORDS SEARCHED / DATA
- Page 610 and 611:
GOVERNMENT RECORDS SEARCHED / DATA
- Page 612 and 613:
GOVERNMENT RECORDS SEARCHED / DATA
- Page 614 and 615:
GOVERNMENT RECORDS SEARCHED / DATA
- Page 616 and 617:
GOVERNMENT RECORDS SEARCHED / DATA
- Page 618 and 619:
GOVERNMENT RECORDS SEARCHED / DATA
- Page 620 and 621:
GOVERNMENT RECORDS SEARCHED / DATA
- Page 622 and 623:
GEOCHECK ® - PHYSICAL SETTING SOUR
- Page 624 and 625:
GEOCHECK ® - PHYSICAL SETTING SOUR
- Page 626 and 627:
GEOCHECK ® - PHYSICAL SETTING SOUR
- Page 628 and 629:
GEOCHECK ® - PHYSICAL SETTING SOUR
- Page 630 and 631:
GEOCHECK ® - PHYSICAL SETTING SOUR
- Page 632 and 633:
GEOCHECK ® - PHYSICAL SETTING SOUR
- Page 634 and 635:
GEOCHECK ® - PHYSICAL SETTING SOUR
- Page 636 and 637:
GEOCHECK ® - PHYSICAL SETTING SOUR
- Page 638 and 639:
GEOCHECK ® - PHYSICAL SETTING SOUR
- Page 640 and 641:
GEOCHECK ® - PHYSICAL SETTING SOUR
- Page 642 and 643:
GEOCHECK ® - PHYSICAL SETTING SOUR
- Page 644 and 645:
GEOCHECK ® - PHYSICAL SETTING SOUR
- Page 646 and 647:
GEOCHECK ® - PHYSICAL SETTING SOUR
- Page 648 and 649:
GEOCHECK ® - PHYSICAL SETTING SOUR
- Page 650 and 651:
GEOCHECK ® - PHYSICAL SETTING SOUR
- Page 652 and 653:
GEOCHECK ® - PHYSICAL SETTING SOUR
- Page 654 and 655:
GEOCHECK ® - PHYSICAL SETTING SOUR
- Page 656 and 657:
GEOCHECK ® - PHYSICAL SETTING SOUR
- Page 658 and 659:
GEOCHECK ® - PHYSICAL SETTING SOUR
- Page 660 and 661:
GEOCHECK ® - PHYSICAL SETTING SOUR
- Page 662 and 663:
GEOCHECK ® - PHYSICAL SETTING SOUR
- Page 664 and 665:
GEOCHECK ® - PHYSICAL SETTING SOUR
- Page 666 and 667:
GEOCHECK ® - PHYSICAL SETTING SOUR
- Page 668 and 669:
GEOCHECK ® - PHYSICAL SETTING SOUR
- Page 670 and 671:
GEOCHECK ® - PHYSICAL SETTING SOUR
- Page 672 and 673:
GEOCHECK ® - PHYSICAL SETTING SOUR
- Page 674 and 675:
GEOCHECK ® - PHYSICAL SETTING SOUR
- Page 676 and 677:
GEOCHECK ® - PHYSICAL SETTING SOUR
- Page 678 and 679:
GEOCHECK ® - PHYSICAL SETTING SOUR
- Page 680 and 681:
GEOCHECK ® - PHYSICAL SETTING SOUR
- Page 682 and 683:
GEOCHECK ® - PHYSICAL SETTING SOUR
- Page 684 and 685:
GEOCHECK ® - PHYSICAL SETTING SOUR
- Page 686 and 687:
GEOCHECK ® - PHYSICAL SETTING SOUR
- Page 688 and 689:
GEOCHECK ® - PHYSICAL SETTING SOUR
- Page 690 and 691:
GEOCHECK ® - PHYSICAL SETTING SOUR
- Page 692 and 693:
GEOCHECK ® - PHYSICAL SETTING SOUR
- Page 694 and 695:
GEOCHECK ® - PHYSICAL SETTING SOUR
- Page 696 and 697:
GEOCHECK ® - PHYSICAL SETTING SOUR
- Page 698 and 699:
GEOCHECK ® - PHYSICAL SETTING SOUR
- Page 700 and 701:
GEOCHECK ® - PHYSICAL SETTING SOUR
- Page 702 and 703:
GEOCHECK ® - PHYSICAL SETTING SOUR
- Page 704 and 705:
GEOCHECK ® - PHYSICAL SETTING SOUR
- Page 706 and 707:
GEOCHECK ® - PHYSICAL SETTING SOUR
- Page 708 and 709:
PHYSICAL SETTING SOURCE RECORDS SEA
- Page 710 and 711:
PHYSICAL SETTING SOURCE RECORDS SEA
- Page 712 and 713:
Technical Memorandum: Emissions Mod
- Page 714 and 715:
EMISSIONS MODELING Contents Page 1.
- Page 716 and 717:
EMISSIONS MODELING 2.0 Assumptions
- Page 718 and 719:
EMISSIONS MODELING 3.0 Results Emis
- Page 720 and 721:
EMISSIONS MODELING Attachment A: ED
- Page 722 and 723:
EMISSIONS MODELING Aircraft Annual
- Page 724 and 725:
Technical Memorandum: Airfield Simu
- Page 726 and 727:
AIRFIELD SIMULATION Contents Page 1
- Page 728 and 729:
AIRFIELD SIMULATION Figure 1 TERMIN
- Page 730 and 731:
AIRFIELD SIMULATION 2.0 Modeling As
- Page 732 and 733:
AIRFIELD SIMULATION 2.2 Weather and
- Page 734 and 735:
AIRFIELD SIMULATION runways in peak
- Page 736 and 737:
AIRFIELD SIMULATION (1) east of Con
- Page 738 and 739:
AIRFIELD SIMULATION Figure 5 TRP TA
- Page 740 and 741:
AIRFIELD SIMULATION Table 3 AIRFIEL
- Page 742 and 743:
AIRFIELD SIMULATION both future yea
- Page 744 and 745:
Technical Memorandum: Traffic Analy
- Page 746 and 747:
TRAFFIC ANALYSIS Contents Page 1.0
- Page 748 and 749:
TRAFFIC ANALYSIS 1.0 Overview This
- Page 750 and 751:
TRAFFIC ANALYSIS The parking garage
- Page 752 and 753:
TRAFFIC ANALYSIS Figure 3 FUTURE AI
- Page 754 and 755:
TRAFFIC ANALYSIS The proportion of
- Page 756 and 757:
TRAFFIC ANALYSIS Figure 4 ESTIMATED
- Page 758 and 759:
TRAFFIC ANALYSIS Figure 6 ESTIMATED
- Page 760 and 761:
TRAFFIC ANALYSIS at the crosswalks
- Page 762 and 763:
TRAFFIC ANALYSIS car companies, and
- Page 764 and 765:
TRAFFIC ANALYSIS Figure 8 3D VIEW O
- Page 766 and 767:
TRAFFIC ANALYSIS 2.4 Calculations T
- Page 768 and 769:
TRAFFIC ANALYSIS Figure 10 CURBSIDE
- Page 770 and 771:
TRAFFIC ANALYSIS Table 4 ANNUAL VMT
- Page 772 and 773:
T E C H N I C A L M E M O R A N D U
- Page 774 and 775:
UPDATED FOR REVISED PHASING AND CON
- Page 776 and 777:
UPDATED FOR REVISED PHASING AND CON
- Page 778 and 779:
ASSUMPTIONS - 10 hour work days - O
- Page 780 and 781:
Lavatory, with Sensor Faucet 22 EA
- Page 782 and 783:
MECHANICAL PLANT Line Items and Qua
- Page 784 and 785:
Basement Excavation, Backfill, Disp
- Page 786 and 787:
Landside Roadways Line Items and Qu
- Page 788 and 789:
TERMINAL BUILDING Line Items and Qu
- Page 790 and 791:
Distribution Boards, Panelboards, F
- Page 792 and 793:
SOUTH CONCOURSE WEST Line Items and
- Page 794 and 795:
Electrical Distibution (Continued)
- Page 796 and 797:
SOUTH CONCOURSE EAST Line Items and
- Page 798 and 799:
Connect Walkways 1 EA NA Connect PC
- Page 800 and 801:
RAC BUILDING Line Items and Quantit
- Page 802 and 803:
Electrical (Continued) QUANTITY UNI
- Page 804 and 805:
NEW PARKING GARAGE Line Items and Q
- Page 806 and 807:
CONNECTORS RENOVATION Line Items an
- Page 808 and 809:
CONCOURSE C RENOVATION Line Items a
- Page 810 and 811:
Potable Water Cabinets 9 EA NA 1 Ch
- Page 812 and 813:
Interior Finishes (Continued) QUANT
- Page 814 and 815:
CONCOURSE B RENOVATION Line Items a
- Page 816 and 817:
Equipment type Hours of use Cement
- Page 818 and 819:
SPREAD SHEEET FOR CALCULATIONS OF C
- Page 820 and 821:
SPREAD SHEEET FOR CALCULATIONS OF C
- Page 822 and 823:
SPREAD SHEEET FOR CALCULATIONS OF C
- Page 824 and 825:
SPREAD SHEEET FOR CALCULATIONS OF C
- Page 826 and 827:
SPREAD SHEEET FOR CALCULATIONS OF C
- Page 828 and 829:
SPREAD SHEEET FOR CALCULATIONS OF C
- Page 830 and 831:
SPREAD SHEEET FOR CALCULATIONS OF C
- Page 832 and 833:
SPREAD SHEEET FOR CALCULATIONS OF C
- Page 834 and 835:
SPREAD SHEEET FOR CALCULATIONS OF C
- Page 836 and 837:
SPREAD SHEEET FOR CALCULATIONS OF C
- Page 838 and 839:
ID Task Name Duration Start Finish
- Page 840 and 841:
PEAK EMISSION ACTIVITIES BY CONSTRU
- Page 842 and 843:
Appendix E Technical Memorandum: Sa
- Page 844 and 845:
SALT LAKE CITY INTERNATIONAL AIRPOR
- Page 846 and 847:
SALT LAKE CITY INTERNATIONAL AIRPOR
- Page 848 and 849:
Appendix F Historic, Architectural,
- Page 850 and 851:
TECHNICAL MEMORANDUM Historical/Arc
- Page 852 and 853:
HISTORICAL/ARCHITECTURAL, ARCHAEOLO
- Page 854 and 855:
HISTORICAL/ARCHITECTURAL, ARCHAEOLO
- Page 856 and 857:
HISTORICAL/ARCHITECTURAL, ARCHAEOLO
- Page 858 and 859:
FAA Section 106 Coordination Letter
- Page 861 and 862:
Applicant’s Determination of Elig
- Page 864 and 865:
Appendix G Agency and Public Involv
- Page 866 and 867:
Agency and Public Scoping Meeting P
- Page 868 and 869:
Why is this Environmental Assessmen
- Page 870 and 871:
Why is the Terminal Redevelopment P
- Page 872 and 873:
Proposed Action: Terminal Redevelop
- Page 874 and 875:
Proposed Action: Terminal Redevelop
- Page 876:
Schedule - Key dates Public/Agency
- Page 879 and 880:
June 1, 2010 Scott Baird, Division
- Page 881 and 882:
June 1, 2010 Walter Baker, Division
- Page 883 and 884:
June 1, 2010 Darin Bird, Deputy Dir
- Page 885 and 886:
June 1, 2010 Chuck Chappell Executi
- Page 887 and 888:
June 1, 2010 Larry Crist, Field Sup
- Page 889 and 890:
June 1, 2010 Forrest Cuch Executive
- Page 891 and 892:
June 1, 2010 Royal DeLegge Director
- Page 893 and 894:
June 1, 2010 Royal DeLegge SLVHD En
- Page 895 and 896:
June 1, 2010 Royal DeLegge SLVHD En
- Page 897 and 898:
June 1, 2010 Mary DeLoretto Environ
- Page 899 and 900:
June 1, 2010 Mike George, Environme
- Page 901 and 902:
June 1, 2010 Cheryl Heying Division
- Page 903 and 904:
June 1, 2010 Hollis Jencks Project
- Page 905 and 906:
June 1, 2010 Charmaine Knighton Dep
- Page 907 and 908:
June 1, 2010 Kevin Luey, Northwest
- Page 909 and 910:
June 1, 2010 Wilson Martin Associat
- Page 911 and 912:
June 1, 2010 Allen McCandless Direc
- Page 913 and 914:
June 1, 2010 Jeff Niermeyer Directo
- Page 915 and 916:
June 1, 2010 Randy Park Region Dire
- Page 917 and 918:
June 1, 2010 Matthew Sibul Senior P
- Page 919 and 920:
June 1, 2010 Amanda Smith, Executiv
- Page 921 and 922:
June 1, 2010 Ed Woolford Environmen
- Page 923:
Public Information Meeting Notices,
- Page 926 and 927:
Ad published June 7, 2010
- Page 929 and 930:
Salt Lake City International Airpor
- Page 931 and 932:
Today’s Presentation • What is
- Page 933 and 934:
What is the Terminal Redevelopment
- Page 935 and 936:
What Alternatives Were Considered?
- Page 937 and 938:
Comparison of Alternatives: Purpose
- Page 939 and 940:
Comparison of Alternatives: Levels
- Page 941 and 942:
Findings: No Significant Adverse Im
- Page 943 and 944:
Findings: No Significant Adverse Im
- Page 945 and 946:
Schedule • Draft EA published - M
- Page 953:
Agency and Public Comments, and Res
- Page 958 and 959:
From: To: Subject: Date: Swank, Ali
- Page 960 and 961:
, , cc, SubjectSalt Lake City Air
- Page 962 and 963:
From: To: Cc: Subject: Date: Willki
- Page 964 and 965:
s/ Doug Fullmer 758 East 4125 South
- Page 966 and 967:
materials such as transformers, and
- Page 968 and 969:
planned right, a new airport can be
- Page 970 and 971:
letter, an agency scoping meeting w
- Page 972 and 973:
From: To: Subject: Date: Swank, Ali
- Page 974 and 975:
From: To: Subject: Date: Swank, Ali
- Page 976 and 977:
From: To: Subject: Date: Swank, Ali
- Page 978 and 979:
From: Nelis, Patty [mailto:Patty.Ne
- Page 981 and 982:
Comments and Responses Regarding th
- Page 983 and 984:
AS ‐ 5 AS ‐ 6 AS ‐ 7 AS ‐ 8
- Page 985 and 986:
AS ‐ 14 AS ‐ 15 “Rental car e
- Page 987 and 988:
RDD/122330004 (NLH4768.DOCX) 7 TBG0
- Page 989 and 990:
COMMENTS AND RESPONSES REGARDING TH
- Page 991 and 992:
COMMENTS AND RESPONSES REGARDING TH
- Page 994:
COMMENTS AND RESPONSES REGARDING TH