

Left Brain Right B - the DBS Vickers Securities Equities Research
Left Brain Right B - the DBS Vickers Securities Equities Research
Left Brain Right B - the DBS Vickers Securities Equities Research

Create successful ePaper yourself
Turn your PDF publications into a flip-book with our unique Google optimized e-Paper software.
Regional Equity Strategy 4Q 2009<br />
Strategy Overview: Asia Equity<br />
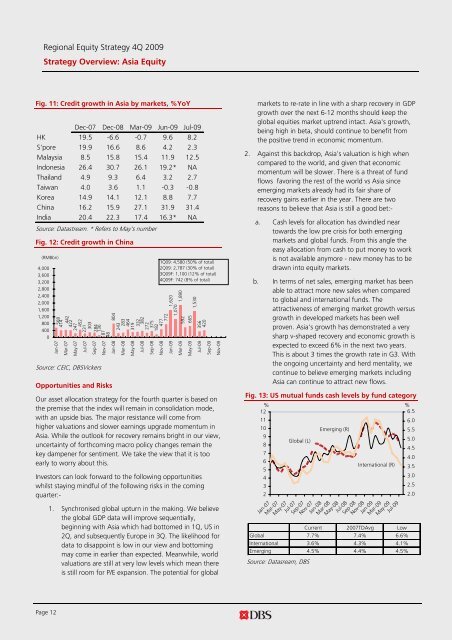
Fig. 11: Credit growth in Asia by markets, %YoY<br />
Dec-07 Dec-08 Mar-09 Jun-09 Jul-09<br />
HK 19.5 -6.6 -0.7 9.6 8.2<br />
S'pore 19.9 16.6 8.6 4.2 2.3<br />
Malaysia 8.5 15.8 15.4 11.9 12.5<br />
Indonesia 26.4 30.7 26.1 19.2* NA<br />
Thailand 4.9 9.3 6.4 3.2 2.7<br />
Taiwan 4.0 3.6 1.1 -0.3 -0.8<br />
Korea 14.9 14.1 12.1 8.8 7.7<br />
China 16.2 15.9 27.1 31.9 31.4<br />
India 20.4 22.3 17.4 16.3* NA<br />
Source: Datastream. * Refers to May’s number<br />
Fig. 12: Credit growth in China<br />
(RMBbn)<br />
4,000<br />
3,600<br />
3,200<br />
2,800<br />
2,400<br />
2,000<br />
1,600<br />
1,200<br />
800<br />
400<br />
0<br />
568<br />
414<br />
442<br />
422<br />
247<br />
452<br />
231<br />
303<br />
284<br />
136<br />
Source: CEIC, <strong>DBS</strong><strong>Vickers</strong><br />
87<br />
48<br />
Opportunities and Risks<br />
804<br />
243<br />
283<br />
464<br />
382<br />
332<br />
319<br />
272<br />
375<br />
182<br />
477<br />
1Q09: 4,580 (50% of total)<br />
2Q09: 2,787 (30% of total)<br />
3Q09F: 1,100 (12% of total)<br />
4Q09F: 742 (8% of total)<br />
Our asset allocation strategy for <strong>the</strong> fourth quarter is based on<br />
<strong>the</strong> premise that <strong>the</strong> index will remain in consolidation mode,<br />
with an upside bias. The major resistance will come from<br />
higher valuations and slower earnings upgrade momentum in<br />
Asia. While <strong>the</strong> outlook for recovery remains bright in our view,<br />
uncertainty of forthcoming macro policy changes remain <strong>the</strong><br />
key dampener for sentiment. We take <strong>the</strong> view that it is too<br />
early to worry about this.<br />
Investors can look forward to <strong>the</strong> following opportunities<br />
whilst staying mindful of <strong>the</strong> following risks in <strong>the</strong> coming<br />
quarter:-<br />
1. Synchronised global upturn in <strong>the</strong> making. We believe<br />
<strong>the</strong> global GDP data will improve sequentially,<br />
beginning with Asia which had bottomed in 1Q, US in<br />
2Q, and subsequently Europe in 3Q. The likelihood for<br />
data to disappoint is low in our view and bottoming<br />
may come in earlier than expected. Meanwhile, world<br />
valuations are still at very low levels which mean <strong>the</strong>re<br />
is still room for P/E expansion. The potential for global<br />
772<br />
1,620<br />
1,070<br />
1,890<br />
592<br />
665<br />
1,530<br />
356<br />
420<br />
Jan-07<br />
Mar-07<br />
May-07<br />
Jul-07<br />
Sep-07<br />
Nov-07<br />
Jan-08<br />
Mar-08<br />
May-08<br />
Jul-08<br />
Sep-08<br />
Nov-08<br />
Jan-09<br />
Mar-09<br />
May-09<br />
Jul-09<br />
Sep-09<br />
Nov-09<br />
markets to re-rate in line with a sharp recovery in GDP<br />
growth over <strong>the</strong> next 6-12 months should keep <strong>the</strong><br />
global equities market uptrend intact. Asia's growth,<br />
being high in beta, should continue to benefit from<br />
<strong>the</strong> positive trend in economic momentum.<br />
2. Against this backdrop, Asia's valuation is high when<br />
compared to <strong>the</strong> world, and given that economic<br />
momentum will be slower. There is a threat of fund<br />
flows favoring <strong>the</strong> rest of <strong>the</strong> world vs Asia since<br />
emerging markets already had its fair share of<br />
recovery gains earlier in <strong>the</strong> year. There are two<br />
reasons to believe that Asia is still a good bet:-<br />
a. Cash levels for allocation has dwindled near<br />
towards <strong>the</strong> low pre crisis for both emerging<br />
markets and global funds. From this angle <strong>the</strong><br />
easy allocation from cash to put money to work<br />
is not available anymore - new money has to be<br />
drawn into equity markets.<br />
b. In terms of net sales, emerging market has been<br />
able to attract more new sales when compared<br />
to global and international funds. The<br />
attractiveness of emerging market growth versus<br />
growth in developed markets has been well<br />
proven. Asia's growth has demonstrated a very<br />
sharp v-shaped recovery and economic growth is<br />
expected to exceed 6% in <strong>the</strong> next two years.<br />
This is about 3 times <strong>the</strong> growth rate in G3. With<br />
<strong>the</strong> ongoing uncertainty and herd mentality, we<br />
continue to believe emerging markets including<br />
Asia can continue to attract new flows.<br />
Fig. 13: US mutual funds cash levels by fund category<br />
%<br />
%<br />
12<br />
11<br />
10<br />
Emerging (R)<br />
9<br />
Global (L)<br />
8<br />
7<br />
6<br />
International (R)<br />
5<br />
4<br />
3<br />
2<br />
Jan-07<br />
Mar-07<br />
May-07<br />
Current 2007TDAvg Low<br />
Global 7.7% 7.4% 6.6%<br />
International 3.6% 4.3% 4.1%<br />
Emerging 4.5% 4.4% 4.5%<br />
Source: Datasream, <strong>DBS</strong><br />
Jul-07<br />
Sep-07<br />
Nov-07<br />
Jan-08<br />
Mar-08<br />
May-08<br />
Jul-08<br />
Sep-08<br />
Nov-08<br />
Jan-09<br />
Mar-09<br />
May-09<br />
Jul-09<br />
6.5<br />
6.0<br />
5.5<br />
5.0<br />
4.5<br />
4.0<br />
3.5<br />
3.0<br />
2.5<br />
2.0<br />
Page 12


