

Left Brain Right B - the DBS Vickers Securities Equities Research
Left Brain Right B - the DBS Vickers Securities Equities Research
Left Brain Right B - the DBS Vickers Securities Equities Research

You also want an ePaper? Increase the reach of your titles
YUMPU automatically turns print PDFs into web optimized ePapers that Google loves.
Regional Equity Strategy 4Q 2009<br />
Strategy Overview: Asia Equity<br />
on <strong>the</strong>m. The fundamental checks are (1) whe<strong>the</strong>r asset price<br />
inflation will eventually start spilling over onto <strong>the</strong> CPI and (2) if<br />
<strong>the</strong>re is cost push inflation, especially from <strong>the</strong> labor market,<br />
raw materials and business costs, which will in turn compress<br />
margins. China's CPI and PPI continued to fall in August,<br />
suggesting <strong>the</strong>re is still no price pressure in China.<br />
Unemployment rate in Asia probably hasn't peaked yet. We<br />
look at <strong>the</strong> formation of bubble markets from three aspects:<br />
stock, property and credit markets. The conclusion is that<br />
<strong>the</strong>re may be premature signs of a bubble but not suggestive<br />
of an imminent burst.<br />
Stock market bubble<br />
A stock market bubble is a type of economic bubble taking<br />
place in stock markets when market participants drive stock<br />
prices above <strong>the</strong>ir value in relation to some measures of stock<br />
valuation.<br />
Valuations<br />
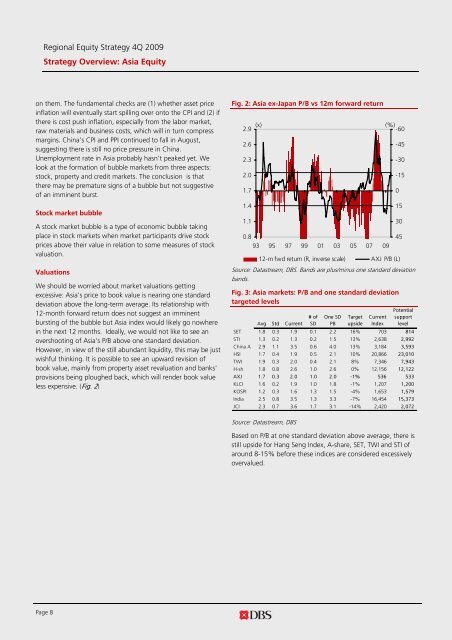
We should be worried about market valuations getting<br />
excessive: Asia's price to book value is nearing one standard<br />
deviation above <strong>the</strong> long-term average. Its relationship with<br />
12-month forward return does not suggest an imminent<br />
bursting of <strong>the</strong> bubble but Asia index would likely go nowhere<br />
in <strong>the</strong> next 12 months. Ideally, we would not like to see an<br />
overshooting of Asia's P/B above one standard deviation.<br />
However, in view of <strong>the</strong> still abundant liquidity, this may be just<br />
wishful thinking. It is possible to see an upward revision of<br />
book value, mainly from property asset revaluation and banks'<br />
provisions being ploughed back, which will render book value<br />
less expensive. (Fig. 2)<br />
Fig. 2: Asia ex-Japan P/B vs 12m forward return<br />
2.9<br />
2.6<br />
2.3<br />
2.0<br />
1.7<br />
1.4<br />
1.1<br />
(x) (%)<br />
-60<br />
0.8<br />
93 95 97 99 01 03 05 07 09<br />
12-m fwd return (R, inv erse scale) AXJ P/B (L)<br />
Source: Datastream, <strong>DBS</strong>. Bands are plus/minus one standard deviation<br />
bands.<br />
Fig. 3: Asia markets: P/B and one standard deviation<br />
targeted levels<br />
Avg Std Current<br />
# of<br />
SD<br />
One SD<br />
PB<br />
Target<br />
upside<br />
Current<br />
Index<br />
Potential<br />
support<br />
level<br />
SET 1.8 0.3 1.9 0.1 2.2 16% 703 814<br />
STI 1.3 0.2 1.3 0.2 1.5 13% 2,638 2,992<br />
China A 2.9 1.1 3.5 0.6 4.0 13% 3,184 3,593<br />
HSI 1.7 0.4 1.9 0.5 2.1 10% 20,866 23,010<br />
TWI 1.9 0.3 2.0 0.4 2.1 8% 7,346 7,943<br />
H-sh 1.8 0.8 2.6 1.0 2.6 0% 12,156 12,122<br />
AXJ 1.7 0.3 2.0 1.0 2.0 -1% 536 533<br />
KLCI 1.6 0.2 1.9 1.0 1.8 -1% 1,207 1,200<br />
KOSPI 1.2 0.3 1.6 1.3 1.5 -4% 1,653 1,579<br />
India 2.5 0.8 3.5 1.3 3.3 -7% 16,454 15,373<br />
JCI 2.3 0.7 3.6 1.7 3.1 -14% 2,420 2,072<br />
-45<br />
-30<br />
-15<br />
0<br />
15<br />
30<br />
45<br />
Source: Datastream, <strong>DBS</strong><br />
Based on P/B at one standard deviation above average, <strong>the</strong>re is<br />
still upside for Hang Seng Index, A-share, SET, TWI and STI of<br />
around 8-15% before <strong>the</strong>se indices are considered excessively<br />
overvalued.<br />
Page 8


