

Left Brain Right B - the DBS Vickers Securities Equities Research
Left Brain Right B - the DBS Vickers Securities Equities Research
Left Brain Right B - the DBS Vickers Securities Equities Research

Create successful ePaper yourself
Turn your PDF publications into a flip-book with our unique Google optimized e-Paper software.
Regional Equity Strategy 4Q 2009<br />
Regional Data Monitor<br />
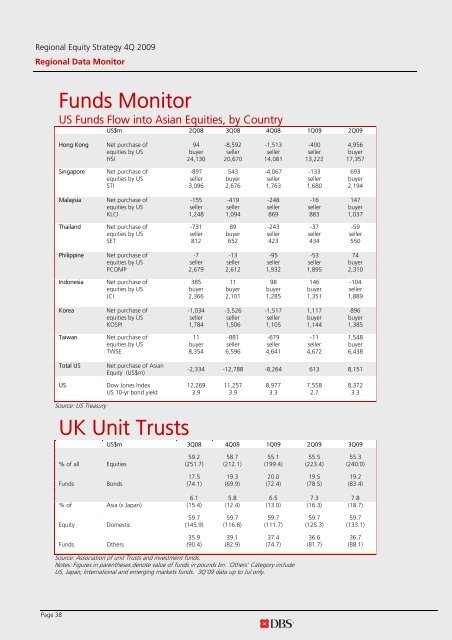
Funds Monitor<br />
US Funds Flow into Asian <strong>Equities</strong>, by Country<br />
US$m 2Q08 3Q08 4Q08 1Q09 2Q09<br />
Hong Kong Net purchase of 94 -8,592 -1,513 -400 4,956<br />
equities by US buyer seller seller seller buyer<br />
HSI 24,130 20,670 14,081 13,222 17,357<br />
Singapore Net purchase of -897 543 -4,067 -133 693<br />
equities by US seller buyer seller seller buyer<br />
STI 3,096 2,676 1,763 1,680 2,194<br />
Malaysia Net purchase of -155 -419 -248 -16 147<br />
equities by US seller seller seller seller buyer<br />
KLCI 1,248 1,094 869 883 1,037<br />
Thailand Net purchase of -731 89 -243 -37 -59<br />
equities by US seller buyer seller seller seller<br />
SET 812 652 423 434 550<br />
Philippine Net purchase of -7 -13 -95 -53 74<br />
equities by US seller seller seller seller buyer<br />
PCOMP 2,679 2,612 1,932 1,895 2,310<br />
Indonesia Net purchase of 385 11 98 146 -104<br />
equities by US buyer buyer buyer buyer seller<br />
JCI 2,366 2,101 1,285 1,351 1,889<br />
Korea Net purchase of -1,034 -3,526 -1,517 1,117 896<br />
equities by US seller seller seller buyer buyer<br />
KOSPI 1,784 1,506 1,105 1,144 1,385<br />
Taiwan Net purchase of 11 -881 -679 -11 1,548<br />
equities by US buyer seller seller seller buyer<br />
TWSE 8,354 6,596 4,641 4,672 6,438<br />
Total US<br />
Net purchase of Asian<br />
Equity (US$m)<br />
-2,334 -12,788 -8,264 613 8,151<br />
US Dow Jones Index 12,269 11,257 8,977 7,558 8,372<br />
US 10-yr bond yield 3.9 3.9 3.3 2.7 3.3<br />
Source: US Treasury<br />
UK Unit Trusts<br />
US$m 3Q08 4Q08 1Q09 2Q09 3Q09<br />
59.2 58.7 55.1 55.5 55.3<br />
% of all <strong>Equities</strong> (251.7) (212.1) (199.4) (223.4) (240.0)<br />
17.5 19.3 20.0 19.5 19.2<br />
Funds Bonds (74.1) (69.9) (72.4) (78.5) (83.4)<br />
6.1 5.8 6.5 7.3 7.8<br />
% of Asia (x Japan) (15.4) (12.4) (13.0) (16.3) (18.7)<br />
59.7 59.7 59.7 59.7 59.7<br />
Equity Domestic (145.9) (116.8) (111.7) (125.3) (133.1)<br />
35.9 39.1 37.4 36.6 36.7<br />
Funds O<strong>the</strong>rs (90.4) (82.9) (74.7) (81.7) (88.1)<br />
Source: Association of unit Trusts and investment funds.<br />
Notes: Figures in paren<strong>the</strong>ses denote value of funds in pounds bn. 'O<strong>the</strong>rs' Category include<br />
US, Japan, International and emerging markets funds. 3Q'09 data up to Jul only.<br />
Page 38


