

Left Brain Right B - the DBS Vickers Securities Equities Research
Left Brain Right B - the DBS Vickers Securities Equities Research
Left Brain Right B - the DBS Vickers Securities Equities Research

Create successful ePaper yourself
Turn your PDF publications into a flip-book with our unique Google optimized e-Paper software.
Regional Equity Strategy 4Q 2009<br />
Strategy Overview: Asia Equity<br />
2010 growth (%)<br />
Risk premiums declining as risk appetites improve<br />
Providing more fuel to our argument that Singapore's equity<br />
valuations have more room for upside is <strong>the</strong> equity risk<br />
premium (ERP). After <strong>the</strong> significant decrease in risk aversion<br />
since March 2009, <strong>the</strong> ERP has reverted to its long-term<br />
average levels of 4.2%. (Fig. 25)<br />
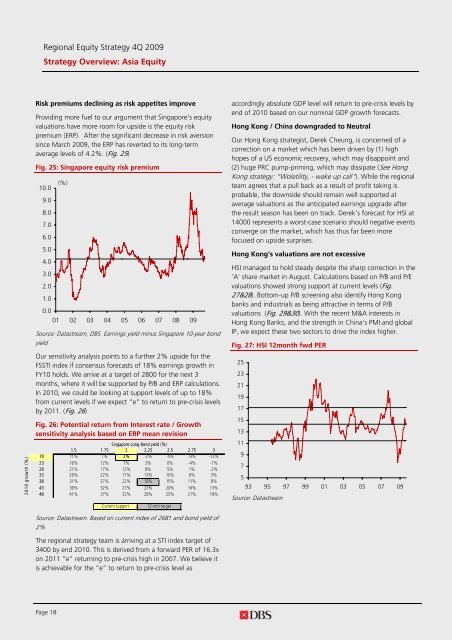
Fig. 25: Singapore equity risk premium<br />
10.0<br />
9.0<br />
8.0<br />
7.0<br />
6.0<br />
5.0<br />
4.0<br />
3.0<br />
2.0<br />
(%)<br />
1.0<br />
0.0<br />
01 02 03 04 05 06 07 08 09<br />
Source: Datastream, <strong>DBS</strong>. Earnings yield minus Singapore 10-year bond<br />
yield<br />
Our sensitivity analysis points to a fur<strong>the</strong>r 2% upside for <strong>the</strong><br />
FSSTI index if consensus forecasts of 18% earnings growth in<br />
FY10 holds. We arrive at a target of 2800 for <strong>the</strong> next 3<br />
months, where it will be supported by P/B and ERP calculations.<br />
In 2010, we could be looking at support levels of up to 18%<br />
from current levels if we expect “e” to return to pre-crisis levels<br />
by 2011. (Fig. 26)<br />
Fig. 26: Potential return from Interest rate / Growth<br />
sensitivity analysis based on ERP mean revision<br />
Singapore Long Bond yield (%)<br />
1.5 1.75 2 2.25 2.5 2.75 3<br />
18 11% 7% 2% -2% -5% -9% -12%<br />
23 16% 12% 7% 3% 0% -4% -7%<br />
28 21% 17% 12% 8% 5% 1% -2%<br />
33 26% 22% 17% 13% 10% 6% 3%<br />
38 31% 27% 22% 18% 15% 11% 8%<br />
43 36% 32% 27% 23% 20% 16% 13%<br />
48 41% 37% 32% 28% 25% 21% 18%<br />
Current support<br />
12-mth target<br />
Source: Datastream. Based on current index of 2681 and bond yield of<br />
2%<br />
The regional strategy team is arriving at a STI index target of<br />
3400 by end 2010. This is derived from a forward PER of 16.3x<br />
on 2011 “e” returning to pre-crisis high in 2007. We believe it<br />
is achievable for <strong>the</strong> “e” to return to pre-crisis level as<br />
accordingly absolute GDP level will return to pre-crisis levels by<br />
end of 2010 based on our nominal GDP growth forecasts.<br />
Hong Kong / China downgraded to Neutral<br />
Our Hong Kong strategist, Derek Cheung, is concerned of a<br />
correction on a market which has been driven by (1) high<br />
hopes of a US economic recovery, which may disappoint and<br />
(2) huge PRC pump-priming, which may dissipate (See Hong<br />
Kong strategy: “Wolatility, - wake up call"). While <strong>the</strong> regional<br />
team agrees that a pull back as a result of profit taking is<br />
probable, <strong>the</strong> downside should remain well supported at<br />
average valuations as <strong>the</strong> anticipated earnings upgrade after<br />
<strong>the</strong> result season has been on track. Derek's forecast for HSI at<br />
14000 represents a worst-case scenario should negative events<br />
converge on <strong>the</strong> market, which has thus far been more<br />
focused on upside surprises.<br />
Hong Kong's valuations are not excessive<br />
HSI managed to hold steady despite <strong>the</strong> sharp correction in <strong>the</strong><br />
'A' share market in August. Calculations based on P/B and P/E<br />
valuations showed strong support at current levels (Fig.<br />
27&28). Bottom-up P/B screening also identify Hong Kong<br />
banks and industrials as being attractive in terms of P/B<br />
valuations (Fig. 29&30). With <strong>the</strong> recent M&A interests in<br />
Hong Kong Banks, and <strong>the</strong> strength in China's PMI and global<br />
IP, we expect <strong>the</strong>se two sectors to drive <strong>the</strong> index higher.<br />
Fig. 27: HSI 12month fwd PER<br />
25<br />
23<br />
21<br />
19<br />
17<br />
15<br />
13<br />
11<br />
9<br />
7<br />
5<br />
93 95 97 99 01 03 05 07 09<br />
Source: Datastream<br />
Page 18


