Advanced Plotting and Model Building - FET
Advanced Plotting and Model Building - FET
Advanced Plotting and Model Building - FET

Create successful ePaper yourself
Turn your PDF publications into a flip-book with our unique Google optimized e-Paper software.
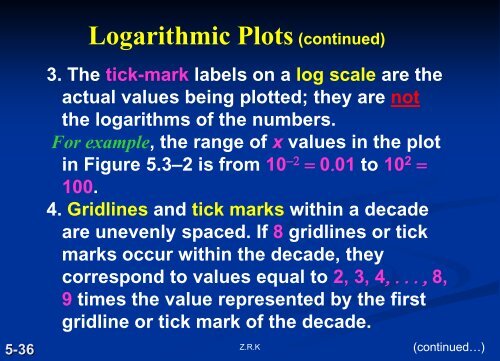
Logarithmic Plots (continued)<br />
5-36<br />
3. The tick-mark labels on a log scale are the<br />
actual values being plotted; they are not<br />
the logarithms of the numbers.<br />
For example, the range of x values in the plot<br />
in Figure 5.3–2 is from 10 −2 = 0.01 to 10 2 =<br />
100.<br />
4. Gridlines <strong>and</strong> tick marks within a decade<br />
are unevenly spaced. If 8 gridlines or tick<br />
marks occur within the decade, they<br />
correspond to values equal to 2, 3, 4, . . . , 8,<br />
9 times the value represented by the first<br />
gridline or tick mark of the decade.<br />
Z.R.K<br />
(continued…)