Simulation of Third Generation CDMA Systems - Virginia Tech
Simulation of Third Generation CDMA Systems - Virginia Tech
Simulation of Third Generation CDMA Systems - Virginia Tech

You also want an ePaper? Increase the reach of your titles
YUMPU automatically turns print PDFs into web optimized ePapers that Google loves.
<strong>Simulation</strong> <strong>of</strong> <strong>Third</strong> <strong>Generation</strong> <strong>CDMA</strong> <strong>Systems</strong>byFakhrul AlamThesis submitted to the faculty <strong>of</strong> the<strong>Virginia</strong> Polytechnic Institute & State Universityin partial fulfillment <strong>of</strong> the requirements <strong>of</strong> the degreeMASTER OF SCIENCEinElectrical EngineeringApproved:Dr. Brian D. Woerner, ChairmanDr. W. H. TranterDr. Jeffrey H. ReedDecember 15, 1999Blacksburg, <strong>Virginia</strong>Keywords: Wideband <strong>CDMA</strong>, <strong>Third</strong> <strong>Generation</strong> <strong>CDMA</strong> <strong>Systems</strong>, WirelessCommunications, <strong>Simulation</strong>
<strong>Simulation</strong> <strong>of</strong> <strong>Third</strong> <strong>Generation</strong> <strong>CDMA</strong> <strong>Systems</strong>Fakhrul AlamABSTRACTThe goal for the next generation <strong>of</strong> mobile communications system is to seamlessly integratea wide variety <strong>of</strong> communication services such as high speed data, video and multimediatraffic as well as voice signals. The technology needed to tackle the challenges to make theseservices available is popularly known as the <strong>Third</strong> <strong>Generation</strong> (3G) Cellular <strong>Systems</strong>. One <strong>of</strong>the most promising approaches to 3G is to combine a Wideband Code Division MultipleAccess (W<strong>CDMA</strong>) air interface with the fixed network <strong>of</strong> Global System for Mobilecommunications (GSM). In this thesis a signal simulator was implemented according to thephysical layer specification <strong>of</strong> the IMT-2000 W<strong>CDMA</strong> system. The data is transmitted in aframe by frame basis through a time varying channel. The transmitted signal is corrupted bymultiple access interference which is generated in a structured way rather than treating it asAdditive White Gaussian Noise (AWGN). The signal is further corrupted by AWGN at thefront end <strong>of</strong> the receiver. Simple rake diversity combining is employed at the receiver. Weinvestigate the bit error rate at both uplink and downlink for different channel conditions.Performance improvement due to error correction coding scheme is shown. The simulatordeveloped can be an invaluable tool for investigating the design and implementation <strong>of</strong>W<strong>CDMA</strong> systems.
AcknowledgmentsI would like to express my gratitude to Dr. Brian D. Woerner for his constant encouragementand belief in me. He has been everything that one could want in an advisor. I am deeplyindebted to my committee members Dr. Jeffrey H. Reed and Dr. W. H. Tranter who havebeen extremely helpful both inside and outside the class. I also want to thank LGIC forsponsoring this research work. Special thanks to Raqibul Mostafa for introducing me toW<strong>CDMA</strong> and his invaluable insights. Yufei Wu deserves my thanks for going through thecodes and providing with corrections and comments. I appreciate the help <strong>of</strong> Pulakesh Royand James Hicks during the implementation <strong>of</strong> the simulator. Thanks to Parvez Ahmad,Masudur Rahman Kazi Zahid and Sujan E. Bin Wadud for reviewing my thesis andproviding valuable feedback. I thank Rennie Givens for all the administrative work. Finally,most <strong>of</strong> all, I thank my parents for their unconditional love and support.III
ContentsAcknowledgements1. Introduction1.1. First <strong>Generation</strong> Cellular <strong>Systems</strong>1.2. Second <strong>Generation</strong> Cellular <strong>Systems</strong>1.3. <strong>Third</strong> <strong>Generation</strong> Cellular <strong>Systems</strong>1.4. W<strong>CDMA</strong>: Air Interface for 3G1.4.1. W<strong>CDMA</strong> Key Features1.4.2. W<strong>CDMA</strong> Key <strong>Tech</strong>nical Characteristics1.5. Outline <strong>of</strong> Thesisiii112356772. W<strong>CDMA</strong> Physical Layer2.1. Physical Channel Structure2.1.1. Uplink Spreading and Modulation2.1.2. Downlink Spreading and Modulation2.2. Uplink Frame Structure2.3. Downlink Frame Structure2.4. Uplink Spreading Codes2.5. Uplink Scrambling Codes2.5.1. Uplink Long Scrambling Codes2.5.2. Uplink Short Scrambling Codes2.6. Downlink Scrambling Codes2.7. Summary <strong>of</strong> the W<strong>CDMA</strong> Modulation2.8. Channel Coding2.8.1. Error Detection2.8.2. Error Correction2.9. Performance Enhancing Schemes2.9.1. Adaptive Antennas99101112141518192123242525252626IV
2.9.2. Transmit Diversity Schemes2.9.3. Advanced Receiver Structure3. Simulator Description3.1. Simulator3.2. Uplink Simulator3.2.1. Desired MS3.2.2. Multiple Access Interference3.2.3. Time Varying Channel3.2.4. Addition <strong>of</strong> Noise3.2.4.1. Calibration <strong>of</strong> Noise3.2.5. Pulse Shaping3.2.6. Rake Receiver3.2.6.1. Description <strong>of</strong> the Rake Receiver3.2.7. BER Counter3.2.8. Analytical Treatment <strong>of</strong> the Uplink Simulator3.3. Downlink Simulator3.3.1. Downlink Transmitter3.3.2. MAI for Downlink3.3.3. BER Counter for Downlink3.4. Graphic User Interface (GUI) for the Simulator3.5. Code Structure <strong>of</strong> the Simulator3.6. Code Optimization272728282929303137373940414343474849494952554. <strong>Simulation</strong> Results4.1. Uplink <strong>Simulation</strong> Results4.2. Downlink <strong>Simulation</strong> Results4.3. Coded System4.4. Summary <strong>of</strong> Results57576266695. Conclusion and Future Work5.1. Future Work7071V
BibliographyVita7275VI
List <strong>of</strong> Tables1.1 3G Data Rate Requirements1.2 W<strong>CDMA</strong> Key <strong>Tech</strong>nical Characteristics2.1 Mapping <strong>of</strong> z v (n)2.2 Parameters <strong>of</strong> W<strong>CDMA</strong> Modulation3.1a Indoor Channel Power Delay Pr<strong>of</strong>ile3.1b Indoor to Outdoor Channel Power Delay Pr<strong>of</strong>ile3.1c Vehicular A Outdoor Channel Power Delay Pr<strong>of</strong>ile3.2 Default Parameters for the Uplink4.1 Performance Improvement due to Coding (Target BER = 10 -3 )3723243232325169VII
List <strong>of</strong> Figures1.1 Evolution <strong>of</strong> 3G2.1 Uplink Spreading and Modulation2.2 Downlink Spreading and Modulation2.3 Frame Structure for Uplink DPDCH/DPCCH2.4 Frame Structure for Downlink DPCH2.5 Code-tree for <strong>Generation</strong> <strong>of</strong> OVSF Codes2.6 Auto-correlation for Two OVSF Codes <strong>of</strong> SF=2562.7a pdf <strong>of</strong> Transition in the Signal Constellation with Proper Code Selection2.7b pdf <strong>of</strong> Transition in the Constellation for Arbitrary Code Selection2.8 <strong>Generation</strong> <strong>of</strong> Scrambling Codes2.9 Histogram <strong>of</strong> Cross-correlation <strong>of</strong> Long Scrambling Codes2.10 Uplink Short Scrambling Code Generator2.11 Initial Conditions at the Shift Registers2.12 <strong>Generation</strong> <strong>of</strong> Downlink Scrambling Codes3.1 Uplink Simulator3.2 Desired MS3.3 Equivalent Channel Model3.4a Frequency Response <strong>of</strong> the Vehicular A Outdoor Channel. (<strong>Simulation</strong>Resolution is 5 Samples per Chip)3.4b Frequency Response <strong>of</strong> the Indoor Channel. (<strong>Simulation</strong> Resolution is 5Samples per Chip)3.5 Time Varying Channel3.6 Implementation <strong>of</strong> Delay <strong>of</strong> τ Samples3.7 Interpolation Noise in the Rayleigh Waveform. (The Factor <strong>of</strong> Interpolation isFive)3.8a Chip3.8b Noise Spectrum41112131415171717192121222429303334343536363838VIII
3.9 Implementation <strong>of</strong> Pulse shaping and Gaussian Noise3.10 Rake Receiver3.11 Descrambling3.12 Despreading3.13 Transmitter3.14 Transmission through Channel and Reception at the Rake Front End3.15 Descrambling at a Rake Branch3.16 Despreading at a Rake Branch3.17 Block Diagram <strong>of</strong> the Downlink Simulator3.18 Downlink Modulation3.19 Main Interface3.20 Interface for Uplink Simulator3.21 Final Menu for the Uplink Simulator3.22a Simulator Code Structure3.22b Simulator Code Structure Continued (Uplink Simulator)3.22c Simulator Code Structure Continued (Downlink Simulator)3.23 Pr<strong>of</strong>ile <strong>of</strong> the Uplink Simulator4.1 BER vs E b /N 0 at the W<strong>CDMA</strong> Uplink for Indoor Channel.(The SpreadingFactor <strong>of</strong> the User is 32.The Number <strong>of</strong> Interferers Vary from 0 to 12)4.2 BER vs E b /N 0 at the W<strong>CDMA</strong> Uplink for Vehicular A Outdoor Channel. (TheSpreading Factor <strong>of</strong> the User is 32. The Number <strong>of</strong> Interferers Vary from 0 to12)4.3 BER vs Interferers at the W<strong>CDMA</strong> Uplink for Indoor Channel.(E b /N 0 is 12 dB)4.4 BER vs Interferers at the W<strong>CDMA</strong> Uplink for Vehicular A OutdoorChannel.(E b /N 0 is 12 dB)4.5 BER vs E b /N 0 at the W<strong>CDMA</strong> Downlink for Indoor Channel.(The SpreadingFactor <strong>of</strong> the User is 32. The Number <strong>of</strong> Interferers Vary from 0 to 12)4.6 BER vs E b /N 0 at the W<strong>CDMA</strong> Downlink for Vehicular A OutdoorChannel.(The Spreading Factor <strong>of</strong> the User is 32. The Number <strong>of</strong> InterferersVary from 0 to 12)3941424243444546484850505252535456585960616263IX
4.7 BER vs Interferers at the W<strong>CDMA</strong> Downlink for Indoor Channel.(E b /N 0 is 12dB)4.8 BER vs Interferers at the W<strong>CDMA</strong> Downlink for Vehicular A OutdoorChannel. (E b /N 0 is 12 dB)4.9 Convolutional Coding Scheme4.10 Uplink Performance for the 9.6 kbps Voice Service in Indoor Channel.(Constraint Length 9, Rate 1/3 Convolutional Coding is Used.)4.11 Uplink Performance for the 9.6 kbps Voice Service in Vehicular A OutdoorChannel. (Constraint Length 9, Rate 1/3 Convolutional Coding is Used.)6465666768X
Chapter 1IntroductionThe goal for the next generation <strong>of</strong> mobile communications system is to seamlessly provide awide variety <strong>of</strong> communication services to anybody, anywhere, anytime. The intendedservice for next generation mobile phone users include services like transmitting high speeddata, video and multimedia traffic as well as voice signals. The technology needed to tacklethe challenges to make these services available is popularly known as the <strong>Third</strong> <strong>Generation</strong>(3G) Cellular <strong>Systems</strong>. The first generation systems are represented by the analog mobilesystems designed to carry the voice application traffic. Their subsequent digital counterpartsare known as second generation cellular systems. <strong>Third</strong> generation systems mark asignificant leap, both in applications and capacity, from the current second generationstandards. Whereas the current digital mobile phone systems are optimized for voicecommunications, 3G communicators are oriented towards multimedia message capability.1.1 First <strong>Generation</strong> Cellular <strong>Systems</strong>The first generation cellular systems generally employ analog Frequency Modulation(FM) techniques. The Advanced Mobile Phone System (AMPS) is the most notable <strong>of</strong> the1
first generation systems. AMPS was developed by the Bell Telephone System. It uses FMtechnology for voice transmission and digital signaling for control information. Other firstgeneration systems include:• Narrowband AMPS (NAMPS)• Total Access Cellular System (TACS)• Nordic Mobile Telephone System (NMT-900)All the first generation cellular systems employ Frequency Division Multiple Access(FDMA) with each channel assigned to a unique frequency band within a cluster <strong>of</strong> cells.1.2 Second <strong>Generation</strong> Cellular <strong>Systems</strong>The rapid growth in the number <strong>of</strong> subscribers and the proliferation <strong>of</strong> manyincompatible first generation systems were the main reason behind the evolution towardssecond generation cellular systems. Second generation systems take the advantage <strong>of</strong>compression and coding techniques associated with digital technology. All the secondgeneration systems employ digital modulation schemes. Multiple access techniques likeTime Division Multiple Access (TDMA) and Code Division Multiple Access (<strong>CDMA</strong>) areused along with FDMA in the second generation systems. Second generation cellular systemsinclude:• United States Digital Cellular (USDC) standards IS-54 and IS-136• Global System for Mobile communications (GSM)• Pacific Digital Cellular (PDC)• cdmaOne2
1.3 <strong>Third</strong> <strong>Generation</strong> Cellular <strong>Systems</strong><strong>Third</strong> generation cellular systems are being designed to support wideband serviceslike high speed Internet access, video and high quality image transmission with the samequality as the fixed networks. The primary requirements <strong>of</strong> the next generation cellularsystems are [1]:• Voice quality comparable to Public Switched Telephone Network (PSTN).• Support <strong>of</strong> high data rate. The following table shows the data rate requirement <strong>of</strong>the 3G systemsTable 1.1: 3G Data Rate RequirementsMobility NeedsVehicularOutdoor to indoor and pedestrianIndoor OfficeMinimum Data Rate144 kbps384 kbps2 Mbps• Support <strong>of</strong> both packet-switched and circuit-switched data services.• More efficient usage <strong>of</strong> the available radio spectrum• Support <strong>of</strong> a wide variety <strong>of</strong> mobile equipment• Backward Compatibility with pre-existing networks and flexible introduction <strong>of</strong>new services and technology• An adaptive radio interface suited to the highly asymmetric nature <strong>of</strong> mostInternet communications: a much greater bandwidth for the downlink than the uplink.3
Research efforts have been underway for more than a decade to introduce multimediacapabilities into mobile communications. Different standard agencies and governing bodiesare trying to integrate a wide variety <strong>of</strong> proposals for third generation cellular systems. Thefollowing figure, adopted from [1], shows the evolution <strong>of</strong> third generation cellular systems:PDCARIB (W<strong>CDMA</strong>)TDDGPRSW<strong>CDMA</strong>MulticarrierMulticodeGSMUTRA (W<strong>CDMA</strong>)FDDEDGE136 HSAMPSIS-54ANSI-136UWC-136136+cdmaOnecdma2000IS-95BFigure 1.1: Evolution <strong>of</strong> 3GReferences [2] and [3] provide further discussion on the evolution <strong>of</strong> third generation cellularsystems.4
1.4. W<strong>CDMA</strong>: Air Interface for 3GOne <strong>of</strong> the most promising approaches to 3G is to combine a Wideband <strong>CDMA</strong>(W<strong>CDMA</strong>) air interface with the fixed network <strong>of</strong> GSM. Several proposal supportingW<strong>CDMA</strong> were submitted to the International Telecommunication Union (ITU) and itsInternational Mobile Telecommunications for the year 2000 (IMT2000) initiative for 3G.Among several organizations trying to merge their various W<strong>CDMA</strong> proposals are• Japan’s Association <strong>of</strong> Radio Industry and Business (ARIB)• Alliance for Telecommunications Industry Solutions (ATIS)• T1P1• European Telecommunications Standards Institute (ETSI) through its SpecialMobile Group (SMG)All these schemes try to take advantage <strong>of</strong> the W<strong>CDMA</strong> radio techniques without ignoringthe numerous advantages <strong>of</strong> the already existing GSM networks. The standard that hasemerged is based on ETSI’s Universal Mobile Telecommunication System (UMTS) and iscommonly known as UMTS Terrestrial Radio Access (UTRA) [1]. The access scheme forUTRA is Direct Sequence Code Division Multiple Access (DS-<strong>CDMA</strong>). The information isspread over a band <strong>of</strong> approximately 5 MHz. This wide bandwidth has given rise to the nameWideband <strong>CDMA</strong> or W<strong>CDMA</strong>. There are two different modes namely• Frequency Division Duplex (FDD)• Time Division Duplex (TDD)Since different regions have different frequency allocation schemes, the capability to operatein either FDD or TDD mode allows for efficient utilization <strong>of</strong> the available spectrum. A briefdefinition <strong>of</strong> FDD and TDD modes is given next.5
FDD: The uplink and downlink transmissions employ two separated frequency bandsfor this duplex method. A pair <strong>of</strong> frequency bands with specified separation is assigned for aconnection.TDD: In this duplex method, uplink and downlink transmissions are carried over thesame frequency band by using synchronized time intervals Thus time slots in a physicalchannel are divided into transmission and reception part.We developed the simulator for a W<strong>CDMA</strong> system operating in the FDD mode. So allthe system description provided in chapter 2 holds for the FDD mode only.1.4.1 W<strong>CDMA</strong> Key FeaturesThe key operational features <strong>of</strong> the W<strong>CDMA</strong> radio interface are listed below [3], [4]:• Support <strong>of</strong> high data rate transmission: 384 kbps with wide area coverage, 2Mbps with local coverage.• High service flexibility: support <strong>of</strong> multiple parallel variable rate services oneach connection.• Both Frequency Division Duplex (FDD) and Time Division Duplex (TDD).• Built in support for future capacity and coverage enhancing technologies likeadaptive antennas, advanced receiver structures and transmitter diversity.• Support <strong>of</strong> inter frequency hand over and hand over to other systems,including hand over to GSM.• Efficient packet access.6
1.4.2 W<strong>CDMA</strong> Key <strong>Tech</strong>nical CharacteristicsThe following table shows the key technical features <strong>of</strong> the W<strong>CDMA</strong> radio interface:Table 1.2: W<strong>CDMA</strong> Key <strong>Tech</strong>nical CharacteristicsMultiple Access SchemeDuplex SchemePacket AccessMultirate/Variable rate schemeChip RateCarrier SpacingFrame LengthInter Base Station synchronizationDS-<strong>CDMA</strong>FDD/TDDDual mode (Combined and dedicated channel)Variable spreading factor and multi-code3.84 Mcps4.4-5.2 MHz (200 kHz carrier raster)10 msFDD: No accurate synchronization neededTDD: Synchronization requiredChannel Coding Scheme Convolutional Code (rate 1/2 and 1/3)Turbo codeThe chip rate may be extended to two or three times the standard 3.84 Mcps toaccommodate for data rates higher than 2 Mbps. The 200 kHz carrier raster has been chosento facilitate coexistence and interoperability with GSM.1.5 Outline <strong>of</strong> ThesisA brief description <strong>of</strong> key features <strong>of</strong> W<strong>CDMA</strong> system is provided in Chapter one.The physical layer <strong>of</strong> the W<strong>CDMA</strong> system is described in detail in Chapter two. Chapterthree describes the W<strong>CDMA</strong> simulator. BER simulation results for W<strong>CDMA</strong> system7
employing rake reception in different multipath environment is shown in Chapter four.Chapter four also shows a test case <strong>of</strong> error correction coding applied to an uplink voiceservice application <strong>of</strong> 9.6 kbps. Chapter five concludes the thesis along with providing somefuture research directions.8
Chapter 2W<strong>CDMA</strong> Physical LayerThis chapter provides a layer 1 (also termed as physical layer) description <strong>of</strong> the radio accessnetwork <strong>of</strong> a W<strong>CDMA</strong> system operating in the FDD mode. The spreading and modulationoperation for the Dedicated Physical Channels (DPCH) at both the links is illustrated in detailsince it is the most essential part <strong>of</strong> the simulator that we implemented. The uplink anddownlink data structure for the DPCHs is described. The spreading and scrambling codesused in both the links are investigated. The spreading modulation and data structure forPhysical Random Access channel (PRACH), Synchronization Channel (SCH), etc. aredescribed in detail in [5] and [6] along with those <strong>of</strong> the DPDCHs.2.1 Physical Channel StructureW<strong>CDMA</strong> defines two dedicated physical channels in both links:• Dedicated Physical Data Channel (DPDCH): to carry dedicated data generatedat layer 2 and above.• Dedicated Physical Control Channel (DPCCH): to carry layer 1 controlinformation.Each connection is allocated one DPCCH and zero, one or several DPDCHs. Inaddition, there are common physical channels defined as:9
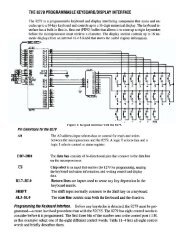
• Primary and secondary Common Control Physical Channels (CCPCH) tocarry downlink common channels• Synchronization Channels (SCH) for cell search• Physical Random Access Channel (PRACH)The spreading and modulation for the DPDCH and the DPCCH for both the links aredescribed in the following two subsections.2.1.1 Uplink Spreading and ModulationIn the uplink the data modulation <strong>of</strong> both the DPDCH and the DPCCH is BinaryPhase Shift Keying (BPSK). The modulated DPCCH is mapped to the Q-channel, while thefirst DPDCH is mapped to the I-channel. Subsequently added DPDCHs are mappedalternatively to the I or the Q-channel. Spreading Modulation is applied after data modulationand before pulse shaping. The spreading modulation used in the uplink is dual channelQPSK. Spreading modulation consists <strong>of</strong> two different operations. The first one is spreadingwhere each data symbol is spread to a number <strong>of</strong> chips given by the spreading factor. Thisincreases the bandwidth <strong>of</strong> the signal. The second operation is scrambling where a complexvalued scrambling code is applied to spread signal. Figure 2.1 shows the spreading andmodulation for an uplink user. The uplink user has a DPDCH and a DPCCH.The bipolar data symbols on I and Q branches are independently multiplied bydifferent channelization codes. The channelization codes are known as Orthogonal VariableSpreading Factor (OVSF) codes. OVSF codes are discussed in section 2.4.10
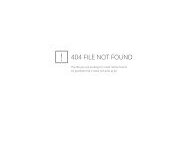
Channelization Code(C D )cos(ω c t)Data (DPDCH)Scrambling Code(C SC )p(t)Control (DPCCH)jp(t)Channelization Code(C C )sin(ω c t)Figure 2.1: Uplink Spreading and ModulationThe resultant signal is multiplied by a complex scrambling code. The complexscrambling code is a unique signature <strong>of</strong> the mobile station. Next, the scrambled signal ispulse shaped. Square-Root Raised Cosine filters with roll-<strong>of</strong>f factor <strong>of</strong> 0.22 are employed forpulse shaping. The pulse shaped signal is subsequently upconverted as shown in Figure 2.1.The application <strong>of</strong> a complex scrambling code with spreading modulation asdescribed above is usually termed as Hybrid Phase Shift Keying (HPSK). HPSK reduces thepeak-to-average power <strong>of</strong> the mobile station by generating the complex scrambling sequencein a special way [7]. The generation <strong>of</strong> complex scrambling code is discussed in section 2.5.The spreading factor for the control channel is always set at the highest value whichis 256. This improves the noise immunity at the control channel by taking advantage <strong>of</strong> thehighest possible processing gain.2.1.2 Downlink Spreading and ModulationQuaternary Phase Shift Keying (QPSK) is applied for data modulation in thedownlink. Each pair <strong>of</strong> two bits are serial-to-parallel converted and mapped to the I and Qbranches respectively. The data in the I and Q branches are spread to the chip rate by thesame channelization code. The channelization code is the same OVSF codes mentioned insection 2.1.1. This spread signal is then scrambled by a cell specific scrambling code. Figure11
2.2 shows the spreading and modulation for a downlink user. The downlink user has aDPDCH and a DPCCH. Additional DPDCHs are QPSK modulated and spread with differentchannelization codes.cos(ω c t)Scrambling Code(C SC )p(t)DPDCH/DPCCHSerialtoParallelChannelization Code(C ch )jp(t)sin(ω c t)Figure 2.2: Downlink Spreading and ModulationWe can observe some differences between the spreading and modulation in thedownlink and that in the uplink. The data modulation is QPSK in downlink whereas it isBPSK for the uplink. The data rates in the I and Q-channels are the same in the downlinkwhereas data rates in the I and Q-channel <strong>of</strong> the uplink may be different. The scramblingcode is cell specific in the downlink, whereas it is mobile station specific in the uplink.As in the uplink, Square-Root Raised Cosine filters with roll-<strong>of</strong>f factor <strong>of</strong> 0.22 areemployed for pulse shaping. The pulse shaped signal is subsequently upconverted as shownin Figure 2.2. The OVSF codes and the scrambling codes are described in sections 2.4 and2.5 respectively.2.2 Uplink Frame StructureFigure 2.3 shows the principal frame structure <strong>of</strong> the uplink dedicated physicalchannels. Each frame <strong>of</strong> 10 ms is split into 15 slots. Each slot is <strong>of</strong> length 2560 chips,corresponding to one power control period. The super frame length is 720 ms; i.e. a superframe corresponds to 72 frames.12
DataPilotTFCI FBI TPCT slot =2560 chips, 10×2 k bits (k = 0..6)Slot 1 Slot i Slot 15T f =10 msFrame 1 Frame i Frame 72T super =720 msFigure 2.3: Frame Structure for Uplink DPDCH/DPCCHPilot bits assist coherent demodulation and channel estimation. TFCI stands fortransport format combination indicator and is used to indicate and identify severalsimultaneous services. Feedback Information (FBI) bits are to be used to support techniquesrequiring feedback. TPC which stands for transmit power control is used for power controlpurposes. The exact number <strong>of</strong> bits <strong>of</strong> these different uplink DPCCH fields is given in [6].The parameter k in Figure 2.3 determines the number <strong>of</strong> bits in each slot. It is relatedto spreading factor (SF) <strong>of</strong> the physical channel asSF= 256k2(2.1)The spreading factor thus may range from 256 down to 4. The spreading factor isselected according to the data rate.13
2.3 Downlink Frame StructureFigure 2.4 shows the principal frame structure <strong>of</strong> the downlink dedicated physicalchannels. As in the uplink, each frame <strong>of</strong> 10 ms is split into 15 slots. Each slot is <strong>of</strong> length2560 chips, corresponding to one power control period. A super frame corresponds to 720ms, i.e. the super frame length corresponds to 72 frames.TFCI Data 1 TPC Data 2 PilotT slot =2560 chips, 10×2 k bits (k = 0..7)Slot 1 Slot i Slot 15T f =10 msFrame 1 Frame i Frame 72T super =720 msFigure 2.4: Frame Structure for Downlink DPCHThe parameter k is related to the SF <strong>of</strong> the physical channel asSF= 512k2(2.2)The spreading factor thus has a range <strong>of</strong> 4 to 512. Thus an additional spreading factor<strong>of</strong> 512 is permitted at the downlink. The different control bits have similar meaning to thosein the uplink. The exact number <strong>of</strong> bits in each <strong>of</strong> the downlink DPCH fields is described in[6].14
2.4 Uplink Spreading CodesThe spreading code, as the name suggests, spreads the data to the chip rate <strong>of</strong> 3.84mega chips per second (Mcps). The most important purpose <strong>of</strong> the spreading codes is to helppreserve orthogonality among different physical channels <strong>of</strong> the uplink user. As mentioned insection 2.1.1, OVSF codes are employed as uplink spreading codes. OVSF codes can beexplained using the code tree shown in the next figure. The subscript here gives the spreadingfactor and the argument within the parenthesis provides the code number for that particularspreading factor.c 4 (1)= (1,1,1,1)c 2 (1)=(1,1)c 4 (2)= (1,1,-1,-1)c 1 (1)= (1)c 2 (2)= (1,-1)c 4 (3)= (1,-1,1,-1)c 4 (4)= (1,-1,-1,1)SF = 1 SF = 2SF = 4Figure 2.5: Code-tree for <strong>Generation</strong> <strong>of</strong> OVSF CodesEach level in the code tree defines spreading codes <strong>of</strong> length SF, corresponding to aparticular spreading factor <strong>of</strong> SF. The number <strong>of</strong> codes for a particular spreading factor isequal to the spreading factor itself. All the codes <strong>of</strong> the same level constitute a set and theyare orthogonal to each other. Any two codes <strong>of</strong> different levels are orthogonal to each otheras long as one <strong>of</strong> them is not the mother <strong>of</strong> the other code [8]. For example the codesc 16 (2),c 8 (1) and c 4 (1) are all mother codes <strong>of</strong> c 32 (3) and hence are not orthogonal to c 32 (32).Thus all the codes within the code tree can not be used simultaneously by a mobile station. A15
code can be used by an MS if and only if no other code on the path from the specific code tothe root <strong>of</strong> the tree or in the sub-tree below the specific code is used by the same MS [5]. Thegeneration method <strong>of</strong> OVSF can be explained with the help <strong>of</strong> the following matrixequations:c () 1 = 1!!!1ccccccc224444() 1( 2)() 1( 2)() 3( 4)NcccNN"$# = !"$# = !( N -1)N() 1( 2)..( N)c1() 1 c1()1 1 1c1() 1 c1()1$# = 1 -1cccc"$#2222() 1 c() 1 c( 2)c( 2)c=!2222() 1""#$!"$#1 1 1 1() 1 1 1 1 1( 2)1 1 1 1# = - -- -( 2)1 -1 -1 1ccœœ!() 1 c () 1N/ 2 N/2() 1 c () 1N/ 2 N/2. .. .c ( N / 2) c ( N / 2)N/ 2 N/2c ( N / 2) c ( N)N/ 2 N/2"$#"#$(2.3)In the above matrix notation, an over bar indicates binary complement (e.g.1=- 1 and- 1=1) and N is an integral power <strong>of</strong> two.The OVSF codes do not have a single, narrow auto-correlation peak as shown infigure 2.6. As a consequence code-synchronization may become difficult. OVSF codesexhibit perfect orthogonality only at zero lags and even this does not hold for partialsequencecross-correlation. As a result the advantage <strong>of</strong> using OVSF codes is lost when allthe users are not synchronized to a single time base or when significant multipath is present.16
Figure 2.6: Auto-correlation for Two OVSF Codes <strong>of</strong> SF=256Figure 2.7 a: pdf <strong>of</strong> Transition in the Figure 2.7b: pdf <strong>of</strong> Transition in theSignal Constellation with Proper Code Constellation for Arbitrary CodeSelectionSelectionThe first code <strong>of</strong> any code tree as described in this section is used to spread theDPCCH. This is a sequence <strong>of</strong> all 1’s for any SF. The first DPDCH is spread by the codenumber (SF/4+1) where SF is the spreading factor for the data channel. As for example, the5 th code is used for spreading the first DPDCH for a spreading factor <strong>of</strong> 16. So the spreadingcode for the first DPDCH is always a repetition <strong>of</strong> {1,1, -1, -1}. Subsequently addedDPDCHs for multi-code transmission are spread by codes in ascending order starting fromcode number 2 excepting the code used for the first DPDCH. Code selection in this orderlymanner along with the proper choice <strong>of</strong> scrambling code increases the spectral efficiency bylimiting the diagonal transitions in the signal constellation. This also results into efficient use17
<strong>of</strong> the power amplifier. Figures 2.7(a) and 2.7(b) show the probability density function <strong>of</strong> thetransitions in the signal constellation <strong>of</strong> the scrambled signal. The transition <strong>of</strong> π indicates adiagonal transition in the signal constellation. As we can observe, proper selection <strong>of</strong> thespreading code can reduce the diagonal transitions in the signal constellation by a significantamount.2.5 Uplink Scrambling CodesUplink Scrambling codes help maintain separation among different mobile stations.Either short or long scrambling codes can be used in the uplink. Short scrambling codes arerecommended for base stations equipped with advanced receivers employing multiuserdetection or interference cancellation. Since we employed a simple rake receiver, we usedlong scrambling codes in the simulator.Scrambling codes (both short and long) can be defined with the help <strong>of</strong> the followingequationCsc = C w + jw C ‡1( 1 2 2) (2.4)Here,C 1 is a real chip rate code;C 2 ’ is a decimated version <strong>of</strong> a real chip rate code C 2 .The usual decimation factor is 2 so that,C ‡( 2k) = C ‡( 2k + 1) = C ( 2k) (2.5)2 2 2w 1 is a repetition <strong>of</strong> {1 1} at the chip ratew 2 is a repetition <strong>of</strong> {1 -1} at the chip rateSo we can writeC C jw CCsc= + ‡1 2 1 2(2.6)18
The following block diagram shows the implementation <strong>of</strong> equation (2.6). All theaddition and multiplication are performed in modulo 2 arithmetic.C 1C 2↓2C 2 ’jw 2w 2 = {1 -1 1 -1…}Figure 2.8: <strong>Generation</strong> <strong>of</strong> Scrambling CodesThere are two different choices for the period <strong>of</strong> the scrambling codes. ETSI supportsa period <strong>of</strong> 10 ms or 1 frame where as the ARIB proposal calls for a period <strong>of</strong> 36864 radi<strong>of</strong>rames or 2 9 super frames. We followed the ETSI proposal as it makes the implementation <strong>of</strong>our simulator easier.2.5.1 Uplink Long Scrambling CodesLong scrambling codes are constructed as described in section 2.5. The real chip ratecodes C 1 and C 2 are formed as the position wise modulo 2 sum <strong>of</strong> 38400 chip segments <strong>of</strong>two binary m sequences. The binary m sequences are generated from two generatorpolynomials <strong>of</strong> degree 25. This is explained in details below following the discussion in [5]Two binary sequences x and y are generated using the generator polynomialsX25 3 2+ X + 1 and X + X + X + X + 1 respectively. The resulting sequence constitutes25 3segments <strong>of</strong> a set <strong>of</strong> Gold sequences.19
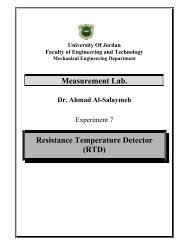
Let n 23 ……..n 0 be the 24 bit binary representation <strong>of</strong> the scrambling code number n(decimal). In the binary representation, n 0 is the least significant bit (LSB). The x sequencedepends on the choice <strong>of</strong> the scrambling code number and is thus denoted as x n . Furthermore,let x n (i) and y(i) denote the i thsymbol <strong>of</strong> the sequences x n and y respectively. The msequences are constructed asThe Initial conditions are set:x ( 0) = n , x ( 1) = n ,......, x ( 22) = n , x ( 23) = n , x ( 24)= 1n 0 n 1 n 22 n 23 ny( 0) = y( 1) = ...... y( 23) = y( 24)= 1(2.7)Then subsequent symbols are generated recursively according to:25x ( i+ 25) = x ( i+ 3) + x ( i) , i = 0, 1,......2 -27n n nmod 225yi ( + 25) = yi ( + 3) + yi ( + 2) + yi ( + 1) + yi ( ) , i= 0, 1,......2 -27mod 2(2.8)The real chip rate code C 1,n and C 2,n for the nth scrambling code are defined asC = x ( 0) + y( 0) , x ( 1) + y( 1) ,...., x ( N - 1) + y( N -1)C1, n n mod 2 n mod 2 nmod 22,n== B% xn( M)xn( M + 1)xn( M + N -1)&K(,,...,'K)K+ y( M)+ y( M + 1)+ y( M + N -1)mod 2 mod 2 mod 2*K(2.9)The scrambling codes are designed so that they have very low cross-correlationamong them. This ensures good Multiple Access Interference (MAI) rejection capability.Figure shows a histogram <strong>of</strong> cross-correlation values for two long scrambling codes.20
0.180.160.140.12Probabilty Density0.10.080.060.040.0200 0.005 0.01 0.015 0.02 0.025 0.03 0.035 0.04 0.045 0.05Correlation ValueFigure 2.9: Histogram <strong>of</strong> Cross-correlation <strong>of</strong> Long Scrambling Codes2.5.2 Uplink Short Scrambling Codes276543210c tmod 2276543210b smod 4z vMappermod 276543210a r3323mod 4Figure 2.10: Uplink Short Scrambling Code GeneratorThe short scrambling codes are generated in the same way as described in section 2.5.Here the real and imaginary parts <strong>of</strong> the complex spreading codes, C 1 and C 2 respectively, aretaken from a family <strong>of</strong> periodically extended S(2) codes. The uplink short codes S v (n),21
n=0,1,..,255, <strong>of</strong> length 256 chips are obtained as the one chip periodic extension <strong>of</strong> S(2)sequences <strong>of</strong> length 255 [5]. So S v (0)=S v (255). Figure 2.10 shows the generation <strong>of</strong> uplinkshort scrambling codes.The quaternary sequence z v (n), 0 ≤ v ≤ 16777216, <strong>of</strong> length 255 is generated by themodulo 4 summation <strong>of</strong> the quaternary sequence a r (n) and the two binary sequences b s (n)and c t (n), i.e.zv( n) = ar( n) + 2bs( n) + 2ct( n) mod 4n = 0,1,..,254 (2.10)The user index v determines the indexes r, s and t in the following way8 16v = r+ 2 . s+2 . tr = 0,,..,1 254s = 0,,..,1 254t = 0,,..,1 254(2.11)vtsrMsb8 bits 8 bits 8 bitsLsbTransformationc t (7) to c t (0) b s (7) to b s (0)a r (7) to a r (0)Figure 2.11: Initial Conditions at the Shift RegistersThe values <strong>of</strong> the indexes s and t are converted to 8-bit binary and used as the initialstates at the respective registers. The value <strong>of</strong> the index r is transformed to an 8-bit wordbefore being used as the initial state at the generator. The transformation is given by:22
ar( 0) = 2vr( 0) + 1 (2.12)mod 4ar( n) = 2vr( n) mod 4n = 1,2,..,7 (2.13)Figure 2.11 shows the initial conditions at the shift registers.The sequence z v (n) is mapped to S v (n) according to the following table:Table 2.1: Mapping <strong>of</strong> z v (n)z v (n)S v (n)0 +1+j1 -1+j2 -1-j3 +1-jThe real and imaginary parts <strong>of</strong> S v (n) are the sequences C 1 (n) and C 2 (n) respectively.2.6 Downlink Scrambling CodesThe downlink scrambling codes are used to maintain cell or sector separation. Thetotal number <strong>of</strong> available scrambling codes is 512. These codes are divided into 32 codegroups with 16 codes in each group. The grouping is done to facilitate fast cell search by themobile [5]. Several scrambling codes might be assigned to one cell for the case adaptiveantennas used to increase the capacity.The downlink scrambling codes are generated in the same way as the uplinkscrambling codes. However the generator polynomials are different. As for example the xsequence (similar to that in the uplink) is constructed using the primitive polynomial7 185 7 10 181+ X + X and the y sequence is constructed from 1+ X + X + X + X . A detailed23
description <strong>of</strong> the generation <strong>of</strong> downlink scrambling code is given in [5]. Figure 2.12 showsthe generation <strong>of</strong> downlink scrambling codes:17 …..7 …..0C 1 or C 217 ... 10 ….. 7 5 …..0Figure 2.12: <strong>Generation</strong> <strong>of</strong> Downlink Scrambling Codes2.7 Summary <strong>of</strong> the W<strong>CDMA</strong> ModulationWe can summarize the discussion on the modulation applied to the dedicated physicalchannels in the following tableTable 2.2 Parameters <strong>of</strong> W<strong>CDMA</strong> ModulationSpreading ModulationData ModulationSpreadingScramblingFrame LengthChip RatePulse ShapingDual Channel QPSK for ULBalanced QPSK for DLBPSK for ULQPSK for DLOVSF codes.4-256 spreading factor for UL4-512 spreading factor for DLComplex Scrambling10 ms3.84 McpsRaised Cosine with 0.22 roll <strong>of</strong>f24
2.8 Channel CodingThe main purpose <strong>of</strong> channel coding is to selectively introduce redundancy into thetransmitted data and improve the wireless link performance in the process [9]. Channel codescan be used to detect as well as correct errors. The W<strong>CDMA</strong> systems have provision for botherror detection and error correction. Channel coding scheme at the W<strong>CDMA</strong> system is acombination <strong>of</strong> error detection, error correction, along with rate matching, interleaving andtransport channels mapping onto/splitting from physical channels [10]. This section gives abrief description on the error detection and error correction schemes recommended for theW<strong>CDMA</strong> systems.2.8.1 Error DetectionError detection is provided by a Cyclic Redundancy Check (CRC) code. The CRC is24,16,8 or 0 bits. The entire transmitted frame is used to compute the parity bits. Any <strong>of</strong> thefollowing cyclic generator polynomials can be used to construct the parity bits:24 23 6 5g ( D)= D + D + D + D + D+12416 12 5g ( D)= D + D + D + D+1168 7 4 3g ( D)= D + D + D + D + D+18(2.14)A detailed description <strong>of</strong> the error detection scheme is given in [10].2.8.2 Error CorrectionTwo alternative error correction schemes have been specified for the W<strong>CDMA</strong>system. They are• Convolutional Coding• Turbo Coding25
For standard services that require BER up to 10 -3 , which is the case for voiceapplications, convolutional coding is to be applied. The constraint length for the proposedconvolutional coding schemes is 9. Both rate 1/2 and 1/3 convolutional coding has beenspecified. For high-quality services that require BER from 10 -3 to 10 -6 , turbo coding isrequired. The feasibility <strong>of</strong> applying 4-state Serial Concatenated Convolutional Code (SCCC)is being investigated by different standardization bodies. Reference [10] provides a detaileddescription <strong>of</strong> the error correction coding schemes along with rate matching, interleaving andtransport channel mapping.In chapter 4 we will apply a rate 1/3, constraint length 9 convolutional codingscheme to an uplink 9.6 kbps voice service and show the BER improvement as a result <strong>of</strong>coding gain.2.9 Performance Enhancing SchemesThe number <strong>of</strong> performance enhancing schemes has been proposed for the W<strong>CDMA</strong>systems. They include adaptive receiving antennas, transmit diversity schemes, and advancedreceiver structures [11].2.9.1 Adaptive AntennasAdaptive antennas at the receiver can increase the capacity and coverage <strong>of</strong> thesystem [12]. Connection dedicated pilot bits can be used in both the links for employingadaptive antennas.26
2.9.2 Transmit Diversity SchemesTransmit diversity schemes at the downlink employ multiple transmit antennas at thebase station. They provide performance enhancement similar to that with multiple antennasat the mobile station receivers. These schemes are attractive since they transfer theprocessing burden to the base station. The transmit diversity schemes proposed for theW<strong>CDMA</strong> systems fall broadly into two different categories:• Open Loop• Closed LoopIn the open loop transmit diversity the techniques are Time Switched Transmit Diversity(TSTD), [6] and Space-Time TD (STTD). A space- time transmit diversity scheme similar tothe one proposed by Alamouti [13] has been evaluated in [14]. The closed loop techniqueincludes the feedback mode Transmit Diversity and Selection Transmit Diversity (STD) [15].2.9.3 Advanced Receiver StructureW<strong>CDMA</strong> systems are designed to provide reasonable service quality without usingcomplex receivers that use joint detection <strong>of</strong> multiple user signals. However if required, shortscrambling codes can be used at the uplink to implement multiuser receivers at moderatecomplexity.27
Chapter 3Simulator DescriptionThis chapter describes the simulator designed to evaluate the Bit Error Rate (BER) at theuplink and the downlink <strong>of</strong> a Wideband <strong>CDMA</strong> (W<strong>CDMA</strong>) system. Data is transmitted in aframe by frame basis over a time varying multipath channel. Receiver design incorporatesrake diversity combining. Additive White Gaussian Noise (AWGN) is added at the front end<strong>of</strong> the rake receiver. Multiple Access Interference (MAI) is generated in a structured wayrather than treating it as AWGN. No error correction coding schemes or antenna diversitytechnique was considered for the basic simulator. However we will show in chapter 4 that thesimulator is very flexible and can be modified to incorporate error correction coding.3.1 SimulatorThe simulator consists <strong>of</strong> two major subsections:• Uplink Simulator• Downlink SimulatorAs their names indicate, these two subsections implement the uplink and thedownlink <strong>of</strong> the simulator respectively. The major differences between them are:1. Frame structure2. The way Multiple Access Interference (MAI) is added to the signal <strong>of</strong> the desireduser28
These differences will become evident as we describe the simulator in the subsequentsections. The following sections contain a detailed description <strong>of</strong> the W<strong>CDMA</strong> simulator.3.2 Uplink SimulatorAt the uplink, the base station receiver receives signals from all the mobile stationtransmitters and demodulates them. The signals from different MS follow different channelsto reach the base station. The block diagram <strong>of</strong> the uplink simulator is shown in figure 3.1.1st InterfererRaisedCosineFilterTimeVaryingChannel2nd InterfererRaisedCosineFilterTimeVaryingChannelNth InterfererRaisedCosineFilterTimeVaryingChannel+MAIDesiredMSRaisedCosineFilterTimeVaryingChannel+RakeReceiverBERCounterGaussianNoiseGeneratorRoot-RaisedCosineFilterFigure 3.1: Uplink SimulatorThe following sub-sections describe each block <strong>of</strong> the uplink simulator.3.2.1 Desired MSThe desired MS is the user for which the simulator estimates the BER. The desireduser has a dedicated control channel and one data application as shown in Figure 3.2. The29
noise variance is calibrated according to the spreading factor <strong>of</strong> the data channel and the BERis evaluated for the data channel only.Channelization Code(C D )Data (DPDCH)Scrambling Code(C SC )Control (DPCCH)jChannelization Code(C C )Figure 3.2: Desired MSThe channelization codes C D and C C are chosen as described in section 2.4. Thescrambling code is an MS specific long code with a period <strong>of</strong> one frame or 10 ms, asdescribed in section 2.5.3.2.2 Multiple Access InterferenceMAI is implemented by generating the signals for a number <strong>of</strong> interfering MS withinthe system. Each interfering user has its own control channel and one data application. Each<strong>of</strong> the interfering mobile station generates its transmitted frame in the same manner as thedesired user. However these frames are not aligned in time with each other or with that <strong>of</strong> thedesired MS. The maximum <strong>of</strong>fset between the frames <strong>of</strong> an interfering user and that <strong>of</strong> thedesired user can be calculated in the following way:Let the cell radius be D km.The maximum <strong>of</strong>fset between the frames <strong>of</strong> a user and an interferer is the time takenby signal to make a round trip <strong>of</strong> D+D = 2D km. This time is given by30
Dt<strong>of</strong>fset = 2 (3.15)cHere c is the velocity <strong>of</strong> light. If we assume a cell radius <strong>of</strong> 20 km we get2t <strong>of</strong>fset= 20 10831034 -= 3 10 4 Sec (3.16)Since we have a chip rate <strong>of</strong> 3.84 Mcps, the maximum <strong>of</strong>fset corresponds to43-4 610 384 . 10 = 512 chips.These asynchronous transmitted frames arrive at the base station via differentmultipath channels and constitute MAI. In this simulator we assume that we have perfectpower control (i.e. all the users transmit at equal power and the received signal at the basestation for all the users are at the same average power level).3.2.3 Time Varying ChannelThe chip rate <strong>of</strong> the W<strong>CDMA</strong> signal is 3.84 Mcps. This narrow pulse width meansthat the multipaths would be resolved most <strong>of</strong> the time and the transmitted signal willencounter frequency selective fading. Three different types <strong>of</strong> multipath channel wereemployed in the simulator. They are1. Indoor channel2. Indoor to Outdoor channel3. Vehicular A Outdoor channelHowever, different channel models like COST 207 [16] or Simple Two Ray Model [17] canalso be easily incorporated with the simulator.Each <strong>of</strong> the three channels employed at the simulator corresponds to differentenvironment as their names suggest. The multipath pr<strong>of</strong>iles <strong>of</strong> the channels shown in the31
following tables are taken from [11], and contain a series <strong>of</strong> specular components with therelative delays and amplitudes indicated.Table 3.1a Indoor Channel Power DelayPr<strong>of</strong>ileTable 3.1b Indoor to Outdoor ChannelPower Delay Pr<strong>of</strong>ileRelative Delay Avg. Power0 050 -3110 -10170 -18290 -26310 -32Relative Delay Avg. Power0 0110 -9.7190 -19.2410 -22.8Table 3.1c Vehicular A Outdoor Channel Power Delay Pr<strong>of</strong>ileRelative Delay Avg. Power0 0310 -1710 -91090 -101730 -152510 -20All the delays in the tables are measured at nano-secs and the power is shown in dBscale. The vehicular A channel has a mobile speed <strong>of</strong> 120 Km per hour associated with itwhere as the other two channels correspond to a pedestrian walking speed <strong>of</strong> 5 Km per hour.A mobile speed <strong>of</strong> 120km/h corresponds to a Doppler spread <strong>of</strong> 223 HZ for a carrierfrequency <strong>of</strong> 2 GHz This is very small compared to the bandwidth <strong>of</strong> the baseband signal andrepresents a relatively slow fading environment.The multipath channel pr<strong>of</strong>iles are converted to the time resolution <strong>of</strong> the simulationmodel in the following way [11]:32
Each ray is split into two rays, one to the sample to the left and one to the sample tothe right. The power <strong>of</strong> these new rays is such that the sum is equal to the original power, andthe power <strong>of</strong> each <strong>of</strong> the new rays is inversely proportional to the distance <strong>of</strong> the original ray.The power <strong>of</strong> all the rays on one sample are added up and normalized. This is graphicallydemonstrated in figure 3.3.0 0.2 1Splitting <strong>of</strong> ray 1Power1 1.252Splitting <strong>of</strong> ray 2Sample0 12Addition <strong>of</strong> the two raysFigure 3.3: Equivalent Channel ModelThe ideal way to convert the multipath pr<strong>of</strong>iles to the time resolution <strong>of</strong> thesimulation is to perform an interpolation with a sin( x)xfunction (sinc) (i.e. employing anideal brick-wall low pass filter). But in that situation, we will have a channel pr<strong>of</strong>ile with alarge number <strong>of</strong> multipath components. Since each <strong>of</strong> the paths is individually Rayleighfaded; this will increase the simulation run time significantly. With the simple interpolationmethod employed in the simulator, we have a small number <strong>of</strong> non-zero components in thereconstructed multipath pr<strong>of</strong>ile. There is a loss <strong>of</strong> information in the interpolation process.33
But if the sampling rate is high enough (4 samples per chip and above) the interpolatedchannel response follows that <strong>of</strong> the original channel very closely in the frequency band <strong>of</strong>interest. This is demonstrated in the following figuresFigure 3.4a: Frequency Response <strong>of</strong> the Vehicular A Outdoor Channel. (<strong>Simulation</strong>Resolution is 5 Samples per Chip)Figure 3.4b: Frequency response <strong>of</strong> the Indoor Channel. (<strong>Simulation</strong> Resolution is 5Samples per Chip)34
The pass-band <strong>of</strong> the pulse shaping filter is the band <strong>of</strong> interest in the simulator. The channelcoefficients are normalized so thatN2Ê h kk = 1= 1, where we have N channel coefficients. Thisnormalization ensures that the average signal energy at both end <strong>of</strong> the channel remains thesame. This allows us to take the energy <strong>of</strong> the signal at the transmitter as the received signalenergy (E b ) during the estimation <strong>of</strong> receiver front end E b /N 0 value.The channels used in the simulator are linear time variant filters. We have a number <strong>of</strong>independently Rayleigh faded components on the sampling instants. Figure 3.5 shows theblock diagram <strong>of</strong> the time varying channelRayleighWaveformRayleighWaveformTransmittedFrameDelay <strong>of</strong> the2nd pathRayleighWaveformDelay <strong>of</strong> theNth pathFigure 3.5: Time Varying ChannelThe delays are implemented by treating each the transmitted data block (a frame <strong>of</strong> 10ms for the simulator) in a circular fashion. To implement a delay <strong>of</strong> τ samples, the last τsamples <strong>of</strong> a transmitted frame are taken out. This block <strong>of</strong> τ samples is then added to thebeginning <strong>of</strong> the truncated transmitted data block. This is shown in the Figure 3.6.The Rayleigh waveform is generated using Clarke’s model [9]. Complex Normalnoise samples, which are uncorrelated in the time domain, are passed through a Doppler35
filter. This Doppler filter imparts correlation to the time domain samples according to theDoppler spread. The Doppler spread is a function <strong>of</strong> the mobile speed. The waveform comingout <strong>of</strong> the Clarke’s model waveform generator has a Rayleigh amplitude distribution and auniform phase distribution between [0,2π]. The mean value <strong>of</strong> the amplitude is unity. Wemultiply this waveform by the amplitude <strong>of</strong> the corresponding path and use that as theRayleigh waveform in the time varying channel <strong>of</strong> figure 3.5.N-τ samplesτsamplesN samples = 1 FrameτsamplesN-τ samplesN samples = 1 FrameFigure 3.6: Implementation <strong>of</strong> Delay <strong>of</strong> τ SamplesFigure 3.7: Interpolation Noise in the Rayleigh Waveform. (The Factor <strong>of</strong> Interpolationis Five)36
The Rayleigh waveform is generated at a sampling rate equal to the chip rate.Samples for higher sampling rate is constructed by interpolation. This reduces the simulationtime significantly at the expense <strong>of</strong> an injection <strong>of</strong> a small amount <strong>of</strong> noise. The noisegenerated as a result <strong>of</strong> interpolating the Rayleigh waveform is insignificant as shown inFigure 3.7.The Rayleigh waveform can be generated at the symbol rate rather than at the chiprate. This will reduce the simulation run time even more. Even for a relatively large Dopplerspread <strong>of</strong> 223 Hz which corresponds to a mobile speed <strong>of</strong> 120 km/h, the interpolation noiseremains below –30 dB for the worst case scenario <strong>of</strong> a sampling factor <strong>of</strong> 8 and a spreadingfactor <strong>of</strong> 256. This noise does not cause any measurable change in the BER.3.2.4 Addition <strong>of</strong> NoiseThe Additive White Gaussian Noise (AWGN) added at the front end <strong>of</strong> the receiver isgenerated by a Gaussian random number generator. The variance <strong>of</strong> the noise distributiondepends on the Signal to Noise Ratio (SNR) or E Nb0at the receiver front end. The noisevariance is also a function <strong>of</strong> the spreading factor, signal amplitude and sampling rate i.e. thenumber <strong>of</strong> samples per chip. The calibration <strong>of</strong> noise is discussed in the following section.3.2.4.1 Calibration <strong>of</strong> NoiseLet us assume for the time being that no pulse shaping is employed. Figure 3.8a and3.8b show the chip and the double sided noise spectrum.37
psdN 0/2AmplitudeTimeAT c-f s/2f s/2fFigure 3.8a: Chip Figure 3.8b: Noise SpectrumHere,Duration <strong>of</strong> chip: T cAmplitude <strong>of</strong> chip: ASampling rate: f sThe energy per chipNoise power spectral density: N 0Ec= A 2 T(3.17)cIf the spreading factor is SF then the energy per bit2E = SF E =( SF)A Tb c c(3.18)The noise variance is given byσ 2 = N f 0 s(3.19)222Eb( SF)A Tc( SF) A ( Tcfs)\ = =22N 2σ/ f 2σ0s(3.20)But T c f s is equal to the number <strong>of</strong> samples per chip, m.So,ENb02( SF)A m=22σ22 ( SF)A mà σ =2( E / N )b0(3.21)38
This expression can be used directly if rectangular pulse shaping is assumed and weintegrate or sum all the samples in a chip to make a decision on the chip at the receiver.However we have to be careful about evaluating noise variance when Raised Cosine pulseshaping is assumed. If at the receiver we sample at the chip rate to reconstruct each chip, wemust use m = 1 in equation (3.7). This is because we are using one sample not m samples formaking a decision on the chip.3.2.5 Pulse ShapingSquare RootRaised CosineFilterChannelSquare RootRaised CosineFilterGaussian NoiseGeneratorSquare RootRaised CosineFilterSquare RootRaised CosineFilterChannelGaussian NoiseGeneratorSquare RootRaised CosineFilterRaised CosineFilterChannelGaussian NoiseGeneratorSquare RootRaised CosineFilter1 Figure 3.9: Implementation <strong>of</strong> Pulse shaping and Gaussian NoiseData is pulse shaped through a Square Root Raised Cosine (Root RC) filter at thetransmitter. The receiver at the base station has a filter matched to the pulse shaping filter atthe transmitter. Both these filters have a roll-<strong>of</strong>f <strong>of</strong> 0.22. In the simulator the transmitter and39
the receiver filters are cascaded and they constitute a Raised Cosine (RC) filter. The noisehas to be passed through a Root RC filter before it is added to the received frame. Thisrearrangement is shown in Figure 3.9. The noise variance is calculated as described in section3.2.4.1.Only the first three lobes <strong>of</strong> the Raised Cosine were considered for implementing thefilters and all the filters were implemented as symmetric FIR filters. Symmetric FIR filtershave a delay equal to half the order <strong>of</strong> the filter. So to take this delay into account we paddedeach transmitted data block by an additional data segment whose size is equal to the delay.So if the delay <strong>of</strong> the filter is N D samples we repeated the first N D samples <strong>of</strong> the data at theend <strong>of</strong> the data block. After the filtering, we removed the first N D output <strong>of</strong> the filter. Weignored the transient <strong>of</strong> the filter. However the transient can be easily removed by passing asmaller data block through the filter and store the state before passing the data frame forpulse shaping.3.2.6 Rake ReceiverMultipath is resolved for W<strong>CDMA</strong> system because <strong>of</strong> the wide bandwidth. Rakereceiver [18] is used to exploit the consequent time diversity. The default number <strong>of</strong> fingersat the base station receiver is four. However any number <strong>of</strong> finger between three and six canbe chosen. The simple case <strong>of</strong> one finger is also provided as an option. The block diagramshown in Figure 3.10 illustrates the implementation <strong>of</strong> the rake receiver. It is assumed thatthe receiver has perfect channel estimation. Maximal Ratio Combining (MRC) is employedfor rake combining [19], [20].40
e -jϕ1FrameAlignmentResamplingDescramblingDespreadz 1e -jϕ2FrameAlignmentResamplingDescramblingDespreadz 2ReceivedFrameMRCe -jϕNFrameAlignmentResamplingDescramblingDespreadz N2 Figure 3.10: Rake Receiver3.2.6.1 Description <strong>of</strong> the Rake ReceiverWhen a frame is transmitted through the time varying channel, it is multiplied withindependent Rayleigh faded waveforms along each path. These time varying waveforms arecomplex. The amplitude distribution is Rayleigh and the phase distribution is uniform in theinterval [0,2π]. The phase associated with the Rayleigh waveform rotates the constellation <strong>of</strong>the transmitted signal. So in the rake receiver we cancel the rotation by multiplying thereceived frame in each branch by the negative <strong>of</strong> the phase associated with that particularpath. We assume that we have perfect phase estimation so that we can cancel out the phasein each branch.The frame alignment block takes care <strong>of</strong> the delay associated with each path so thatwe know the frame boundary at each branch. We then reconstruct each chip from the pulseshaped signal by sampling at the chip rate. This is performed in the Resampling block.Descrambling is performed by multiplying the resampled signal by the complex conjugate <strong>of</strong>41
the desired MS specific scrambling code. The following figure illustrates the descramblingprocessC S*ReconstructedFrameDescrambledFrame3 Figure 3.11: DescramblingC S is the scrambling code <strong>of</strong> the desired Mobile Station in the uplink. It represents thescrambling code <strong>of</strong> the desired base station in the downlink simulator. The asterisk (*)indicates complex conjugation. Figure 3.12 shows the despreading operation,C IRe{}∫dtDescrambledFrameC QIm{}∫dt4 Figure 3.12: Despreadingwhere C I and C Q represent the appropriate spreading codes in figure 3.12.The despread decision statistic from each branch is combined and a hard decision ismade on the bit. Maximal Ratio Combining (MRC) is employed. We assume that we haveperfect amplitude estimate <strong>of</strong> the channel while estimating the weights for MRC.42
3.2.7 BER CounterThe bit error rate counter compares the decision <strong>of</strong> the hard-limiter for the I channelor the data channel to the transmitted data at the I channel and counts the number <strong>of</strong> error.BER is evaluated by averaging the number <strong>of</strong> error over several transmitted frames. At least400 frames are used to compute the BER at low SNR. To compute the BER at higher SNR,as many as 4000 frames were used.3.2.8 Analytical Treatment <strong>of</strong> the Uplink SimulatorLet us assume for the time being that no MAI is present in the system. The followingfigure shows the transmitter and the signals at different points.C I (t)d I (t)C SC (t)d s(t)s(t)d Q (t)jC Q (t)Figure 3.13: TransmitterThe data at the I channel is represented by the signal d I (t), while the data at the Q channel isrepresented by d Q (t).The spread data is denoted as,d () t = d () t c () t + jd () t c () t(3.22)s I I Q Qc I and c Q are I and Q channel spreading codes respectively.43
Finally the transmitted data is given by,st () = d() tc () t(3.23)sscwhere c SC is the complex uplink scrambling code as described in section 2.5.S(t)h(t,τ)r’(t)r(t)n(t)Figure 3.14: Transmission through Channel and Reception at the Rake Front EndEach transmitted signal is passed through a multipath channel as shown in Figure 3.14, wherer(t) is the received signalh(t,τ) is the complex channel responsen(t) is the complex Gaussian noise at the front end <strong>of</strong> the receiverNow,Nr’( t) = Êhi( t, τi) s( t -τi)i=1(3.24)Here we assume that we have N multipath component in the channel. Each <strong>of</strong> these h i (t,τ i ) iscomplex i.e. h() t = h(, t τ ) ei i ijφ(, t τ )The received signal is then given by,iir() t = r‡ () t + n()t(3.25)The following figure represents the signals at the i th finger <strong>of</strong> the rake receiver.44
(t)R i ’(t)R i (t)e -jϕ i C SC * (t-τ i )Figure 3.15: Descrambling at a Rake BranchR () t = r()t e’ - jφi ( t)i= { r‡ ( t) + n( t)}e- jφi () tφi= r‡ () t e + n()t e- j () t - jφi()t(3.26)The second term in equation (3.12) is the complex Gaussian noise with a rotation. Let usdenote that as n i ’(t). So,’ - jφi( t)R () t = r‡ () t e + n () tiNÊijφl() t - jφi()t= h ( t-τ) s( t - τ ) e e + n ‡ ( t)l = 1l l ljφl() t - jφi()t= h( t-τ ) st ( - τ ) + h( t-τ ) st ( - τ ) e e + n ‡ ( t)i i i l l ll = 1lžiNÊii(3.27)The first term in equation (3.13) is the desired signal. Let us call that m i ’(t). Thesecond term is interference due to other paths or the Inter Symbol Interference (ISI). Let usdenote that as I i ’(t). So we haveR‡ () t = m‡ () t + I ‡ () t + n ‡ () t(3.28)i i i i’ *\ R() t = R () t C ( t-τ)i i SC i’ * ’ * ’ *= m() t C ( t- τ ) + I () t C ( t- τ ) + n () t C ( t-τ)i SC i i SC i i SC i(3.29)The first term representing the desired signal m i (t) is given by’ *m() t = m() t C ( t-τ)i i SC i*= h( t-τ ) s( t-τ ) C ( t-τ)i i i SC i*= h( t-τ ) d ( t-τ ) C ( t-τ ) C ( t-τ)i i s i SC i SC i= h( t-τ) d ( t-τ)i i s i(3.30)45
The second term representing the ISI I i (t) is given byNÊj{ φl( t) -φi( t)} *I ( t) = h ( t-τ ) s( t-τ ) e C ( t -τ)i l l ll=1lžiNÊ= h ( t-τ ) d ( t-τ ) C ( t-τ ) C ( t-τ) el = 1lžil l s iSC* j{ φl() t -φi()}tSC l SC ii(3.31)The third term representing the noise n i (t) is given by’ *n () t = n () t C ( t-τ )(3.32)i i SC iThe following figure shows the despreading processR i (t)Re{}x i (t)y i (t)∫z iC I (t-τ i )Figure 3.16: Despreading at a Rake BranchHere z i is the decision statistic for the i th branch <strong>of</strong> the rake receiver. Now,x ( t) = Re{ R ( t)} = Re{ m( t)} + Re{ I ( t)} + Re{ n ( t)}i i i i i= h( t -τ ) d ( t-τ ) C ( t- τ ) + Re{ I ( t)} + Re{ n ( t)}(3.33)i i I i I i i iThereforey () t = x () t C ( t-τ)i i I i= h( t-τ ) d ( t - τ ) + Re{ I ( t)} C ( t- τ ) + Re{ n ( t)} C ( t-τ)i i I i i I i i I i(3.20)So the decision statistic z i is given bywhich may be evaluated asziIT + τ i= yi()t dtτ i(3.21)46
IT+ τT + τi i i I iτ iτ iiiz = h( t-τ ) d ( t- τ ) dt + Re{ I ( t)} C ( t-τ) dtIIT + τi I ii+ Re{ n ( t)} C ( t-τ) dtτii I i(3.22)Here T is the symbol period. If we assume that the magnitude response <strong>of</strong> the channelremains constant for the symbol interval, we getI IT + τT + τi i i I iτ iτ iiiz = Th K+ Re{ I ( t)} C ( t- τ ) dt+ Re{ n ( t)} C ( t-τ) dti I i(3.23)Here K can be either 1 or –1 depending on the transmitted symbol. The second termin equation (3.22) is ISI. Because <strong>of</strong> the processing gain, the ISI is pretty small compared thefirst tem <strong>of</strong> the equation (3.22). The third term here is the noise term.The above analysis can be extended to take the presence <strong>of</strong> MAI into account.Equation (3.22) will be modified as a fourth term corresponding to MAI will be added.3.3 Downlink SimulatorAt the downlink, the mobile station receiver receives the signal transmitted by thebase station transmitter. The MS receives the desired signal along with signals transmitted bythe base station for other mobile stations at the system. The block diagram <strong>of</strong> the downlinksimulator is shown in Figure 3.17.The downlink simulator differs from the uplink simulator in the generation <strong>of</strong> MAI.The frame structure and the spreading and modulation are a also modified from the up link.47
Frame generator<strong>of</strong> the1st interfererFrame generator<strong>of</strong> the2nd interfererFrame generator<strong>of</strong> theNth interferer+MAIFrame generator<strong>of</strong> thedesired user+RaisedCosineFilterTimeVaryingChannel+RakeReceiverBERCounterGaussianNoiseGeneratorRoot-RaisedCosineFilterFigure 3.17: Block Diagram <strong>of</strong> the Downlink Simulator3.3.1 Downlink TransmitterData and control bits are time multiplexed at the transmitter that is a base station forthe downlink. The modulation structure for the downlink is shown in Figure 3.18.Scrambling Code(C SC )DPDCH/DPCCHSerialtoParallelChannelization Code(C ch )jFigure 3.18: Downlink ModulationThe channelization code is the same as described in section 2.4. The scrambling codeis base station specific long code with a period <strong>of</strong> one frame or 10 ms.48
3.3.2 MAI for DownlinkThe MAI in the downlink arises from data frames transmitted by the base stationtransmitter for other users in the system. These frames are modulated in a similar manner <strong>of</strong>Figure 3.18. Each user has its own OVSF code that provides orthogonality among differentusers. The frames are time aligned with each other and with that <strong>of</strong> the desired user. Theyexperience the same multipath channel as the data frame <strong>of</strong> the desired user. This is incontrast with the uplink where the data from different users reaches the receiver via differentchannel. As a result the MAI is implemented in the following way:Additional interfering data frames are generated along with the frame for the desireduser. They are summed up with the frame <strong>of</strong> the desired user, passed through the pulseshapingfilter and subsequently received at the desired MS after going through the timevarying channel. We assume the frames <strong>of</strong> all are transmitted at equal power.3.3.3 BER Counter for DownlinkUnlike the uplink simulator, bit error rate is counted for both the I and Q channels.The mean <strong>of</strong> this error (for one frame) is averaged over several frames to evaluate the BER.3.4 Graphic User Interface (GUI) for the SimulatorThe description <strong>of</strong> the GUI for the simulator is presented in this section. The menudriven interactive GUI includes both the uplink and downlink simulators. For each <strong>of</strong> thesimulators, the user can either select the default values for the parameters or can providevalues <strong>of</strong> his choice. The main menu can be called by typing in the word wcdma at theMatlab command prompt. This generates a window as shown in figure 3.19.49
Figure 3.19: Main InterfaceThen the user can choose either the downlink or uplink simulator by pressing theappropriate buttons. Pressing the uplink button will cause the menu for the uplink simulatorto appear on the screen as shown in figure 3.20.Figure 3.20 Interface for Uplink SimulatorThe uplink simulator provides the user with various parameters describing the overallsystem design. The user can select the parameter E b /N 0 . This can be single value or an array.While giving the values to the simulator, MATLAB syntax has to be followed. Forparameters such as spreading factor, samples per chip, channel and number <strong>of</strong> rake fingersthere are pull-down menus that provide the user with the valid ranges or values for theparticular parameter. Although Raised Cosine pulse shaping is the standard, a pull-down50
menu is provided which gives the option for rectangular pulse shaping as well as RaisedCosine filtering. The number <strong>of</strong> interferers has to be typed in the corresponding text box. Thenumber <strong>of</strong> frame parameter determines how many frames the simulator will process beforegenerating an output. Each <strong>of</strong> these parameters has their default settings as shown in the nexttable:Table 3.2: Default Parameters for the Uplink SimulatorEb/N0 (dB) 5Spreading Factor 32Samples per Chip 1Pulse Shape Raised CosineChannelIndoorInterferer Number 0Rake Finger 4Number <strong>of</strong> Frame 1If the user chooses to run the downlink simulator, then downlink button needs to bepressed after typing in the command wcdma at the Matlab prompt. As far as the parametersare concerned, they have the similar significance as those in the uplink simulator. The onlychange in the default parameters is there are three fingers at the rake receiver unlike fourfingers at the uplink.After the simulation is complete, the simulator provides the user with the options <strong>of</strong>observing the results in either tabular or graphical form. For example, the user can select the’BER Plot ’ button to see the BER performance <strong>of</strong> the receiver or he can select the ’ DisplayBER ’ button to see a table <strong>of</strong> BER vs E b /N 0 . The final menu for the uplink is shown next.51
Figure 3.21: Final Menu for the Uplink Simulator3.5 Code Structure <strong>of</strong> the SimulatorThis section contains a detailed description <strong>of</strong> the program files used in the simulator.Most <strong>of</strong> the code <strong>of</strong> the simulator was written in MATLAB. The following flowchartsillustrate the file structure <strong>of</strong> the uplink and downlink simulators:wcdma.mmainmenu.mupuplinkordownlink?downuplink.mdownlink.mupmenu.mdownmenu.mup_sim.mdown_sim.mFigure 3.22a: Simulator Code Structure52
up_sim.mpar_up.mat ovsf_gen.m scram_real.bin scram_imag.bin over_channel.m up_mpath.m pulse_shaping.m up_mai.mrayleigh.m up_mai_mpath.mup_finalmenu.mFigure 3.22b: Simulator Code Structure Continued (Uplink Simulator)53
down_sim.mpar_down.mat ovsf_gen.m scram_code_down.mat over_channel.m mai_down.m pulse_shaping.m mpath_down.mrayleigh.mdown_finalmenu.mFigure 3.22c: Simulator Code Structure Continued (Downlink Simulator)54
3.6 Code OptimizationThe simulator was implemented in MATLAB to take advantage <strong>of</strong> the built-infunctions that perform various signal processing application like filtering and Fast FourierTransformation (FFT) and the superior array handling capability. To make the simulator runwithin a reasonable simulation time, we had to optimize the MATLAB code. We generatedthe complex scrambling codes separately and stored them in binary data files. During thesimulation run, the simulator reads the desired scrambling codes form these data files. Thiswas necessary since the generation <strong>of</strong> long scrambling code takes long time and it would notbe practical to generate the scrambling codes during running the simulator.Figure 3.23 shows the MATLAB pr<strong>of</strong>ile <strong>of</strong> the uplink simulator. The simulator is runfor Vehicular A Outdoor Channel with one interfering user. The Rayleigh waveform isgenerated at the chip rate. As we notice the simulator spends significant amount <strong>of</strong> time inlines 184 and 173. They correspond to the functions implementing MAI and time varyingchannel respectively. The generation <strong>of</strong> Rayleigh waveform takes up most <strong>of</strong> the simulationtime in both the functions. However generating Rayleigh waveform at symbol rate ratherthan at chip rate can significantly reduce the simulation time. Another way to reduce thesimulation time is to demodulate the signals from the all the interfering users and count theirerrors towards the BER calculation. However this will increase the complexity <strong>of</strong> the receiverimplementation and we will not have the option <strong>of</strong> assigning different spreading factors fordifferent users.55
Figure 3.23: Pr<strong>of</strong>ile <strong>of</strong> the Uplink Simulator56
Chapter 4<strong>Simulation</strong> ResultsThis chapter presents the simulation results for the W<strong>CDMA</strong> system at different channelconditions. <strong>Simulation</strong> results include BER/Frame Error Rate (FER) vs E b /N 0 and BER vsNumber <strong>of</strong> interferers. Improvement in BER due to error correction coding scheme is shownfor a 9.6 kbps uplink service.4.1 Uplink <strong>Simulation</strong> ResultsThe following figures show the BER vs E b /N 0 curves for different number <strong>of</strong> users.The spreading factor at the data channel is 32. The channels are Indoor channel andVehicular A Outdoor Channel. The simulation resolution is 5 samples per chip. We assumethat the received signals from all the users at the base station have equal power, i.e. we haveperfect power control.57
10 0 E b/N 010 -110 -2BER10 -310 -410 -50 interferer2 interferers4 interferers8 interferers12 interferers10 -60 2 4 6 8 10 12Figure 4.1: BER vs E b /N 0 at the W<strong>CDMA</strong> Uplink for Indoor Channel.(The Spreading Factor <strong>of</strong> the User is 32.The Number <strong>of</strong> Interferers Vary from 0 to 12)58
10 0 E b/N 010 -1BER10 -210 -30 interferer2 interferers4 interferers8 interferers12 interferers10 -40 2 4 6 8 10 12Figure 4.2: BER vs E b /N 0 at the W<strong>CDMA</strong> Uplink for Vehicular A Outdoor Channel.(The Spreading Factor <strong>of</strong> the User is 32. The Number <strong>of</strong> Interferers Vary from 0 to 12)We can see from Figure 4.1 and 4.2 that the system becomes interference limited asthe number <strong>of</strong> interferer increases. This is expected for any communications systememploying <strong>CDMA</strong> as the multiple access technique.Figure 4.3 and 4.4 show the BER vs Number <strong>of</strong> interfering users. The SNR is fixed at12 dB. As before, the simulation resolution is 5 samples per chip for both the channels.59
10 -1 Number <strong>of</strong> Interferers10 -2BER10 -3sf=32sf=16sf=8sf=40 2 4 6 8 10 12Figure 4.3: BER vs Interferers at the W<strong>CDMA</strong> Uplink for Indoor Channel.(E b /N 0 is 12 dB)60
10 0 Number <strong>of</strong> Interfererssf=32sf=16sf=8sf=410 -1BER10 -210 -30 2 4 6 8 10 12Figure 4.4: BER vs Interferers at the W<strong>CDMA</strong> Uplink for Vehicular A OutdoorChannel.(E b /N 0 is 12 dB)We can observe from the figures that as the system load reaches 50%, the BERapproaches to 10% which obviously is unacceptable. However with error correction codingand antenna diversity schemes, the BER can be pushed back to an acceptable limit.61
4.2 Downlink <strong>Simulation</strong> ResultsBER performance at the downlink is presented in this section. The following figuresillustrates the BER vs E b /N 0 curves at the downlink for different number <strong>of</strong> interfering users.The simulation resolution is 5 samples per chip. BER for both Indoor channel and VehicularA Outdoor channel is shown. The spreading factor is 32. We assume that the signals for allthe users are transmitted at equal power.10 0 E b/N 010 -110 -2BER10 -310 -40 interferer2 interferers4 interferers8 interferers12 interferers10 -50 2 4 6 8 10 12Figure 4.5: BER vs E b /N 0 at the W<strong>CDMA</strong> Downlink for Indoor Channel.(The Spreading Factor <strong>of</strong> the User is 32. The Number <strong>of</strong> Interferers Vary from 0 to 12)62
10 0 E b/N 00 interferer2 interferers4 interferers8 interferers12 interferers10 -1BER10 -210 -30 2 4 6 8 10 12Figure 4.6: BER vs E b /N 0 at the W<strong>CDMA</strong> Downlink for Vehicular A Outdoor Channel.(The Spreading Factor <strong>of</strong> the User is 32. The Number <strong>of</strong> Interferers Vary from 0 to 12)As in the uplink, the system is interference limited at the downlink for higher number<strong>of</strong> interfering users. However, since the users are synchronized, the orthogonality amongusers is better at the downlink.Figure 4.7 and 4.8 show the BER vs Number <strong>of</strong> interfering users. The SNR is fixed at12 dB. As before, the simulation resolution is 5 samples per chip for both the channels.63
10 -1 Number <strong>of</strong> Interferers10 -2BER10 -310 -4sf=32sf=16sf=8sf=410 -50 2 4 6 8 10 12Figure 4.7: BER vs Interferers at the W<strong>CDMA</strong> Downlink for Indoor Channel.(E b /N 0 is 12 dB)64
10 -1 Number <strong>of</strong> InterferersBER10 -2sf=32sf=16sf=8sf=410 -30 2 4 6 8 10 12Figure 4.8: BER vs Interferers at the W<strong>CDMA</strong> Downlink for Vehicular A OutdoorChannel.(E b /N 0 is 12 dB)65
4.3 Coded SystemA test case <strong>of</strong> error correction coding was implemented for an uplink voiceapplication that has a data rate <strong>of</strong> 9.6 kbps. A rate 1/3 constraint length 9 convolutionalcoding was employed at the transmitter. A Viterbi s<strong>of</strong>t decision decoder was used at thereceiver. We did not implement any error detection scheme or interleaving with that. Thefollowing figure shows the encoder used at the transmitter:Output 0G0=557 OCTInputD D D D D D D DOutput 1G1=663 OCTOutput 2G0=711 OCTFigure 4.9: Convolutional Coding SchemeThe data rate out <strong>of</strong> the vocoder is 8 kbps for a voice service <strong>of</strong> 9.6 kbps. So there are80 data bits in a frame <strong>of</strong> 10 ms. 16 more bits are added with each frame as CyclicRedundancy Check (CRC). So we have 96 bits for each 10 ms frame resulting in an uncodeddata rate <strong>of</strong> 9.6 kbps. The number <strong>of</strong> tail bits to be added is decided as one less than the66
constraint length. So for a constraint length 9 convolutional coding 8 tail bits are added. So ifthe code rate is 1/3, Code frame size = ( 96 + 8) 3 = 312 bitsThe closest frame size available is 300 bits. So 12 bits are punctured at each frame toperform rate matching. A frame size <strong>of</strong> 300 bits corresponds to a spreading factor <strong>of</strong> 128.The following figures show the Frame Error Rate (FER) curves along with BERcurves for the coded system:10 0 E b/N 0BERFER10 -1BER/FER10 -210 -30 0.5 1 1.5 2 2.5Figure 4.10: Uplink Performance for the 9.6 kbps Voice Service in Indoor Channel.(Constraint Length 9, Rate 1/3 Convolutional Coding is Used.)67
10 0 E b/N 0BERFER10 -1BER/FER10 -210 -310 -40 1 2 3 4 5 6 7Figure 4.11: Uplink Performance for the 9.6 kbps Voice Service in Vehicular AOutdoor Channel. (Constraint Length 9, Rate 1/3 Convolutional Coding is Used.)As we can see we get improvement in the BER performance <strong>of</strong> the system because <strong>of</strong>the coding gain. The following table compares the E b /N 0 values required to achieve BER <strong>of</strong>10 -3 for both the coded and the uncoded system at Indoor and Vehicular A Outdoorenvironment.68
Table 4.1: Performance Improvement due to Coding (Target BER=10 -3 )ChannelRequired SNR for Uncoded Required SNR for CodedSystemSystemIndoor 6.8 dB 2.1 dBVehicular A 11.5 dB 6.75<strong>of</strong> 9.6 kbps.It is evident that we get a coding gain <strong>of</strong> approximately 4.7 dB for the uplink service4.4 Summary <strong>of</strong> Results• Orthogonality among channels is preserved better at the downlink.• The system is interference limited at both the links for higher number <strong>of</strong> users.• As the system load approaches 50%, the performance for the uncoded systembecomes unacceptable.• Convolutional coding can provide with a gain <strong>of</strong> 4.7 dB for 9.6 kbps voiceservice at the uplink.69
Chapter 5Conclusion and Future WorkWe implemented a signal simulator according to the physical layer specification <strong>of</strong> the IMT-2000 W<strong>CDMA</strong> system. The data is transmitted in a frame by frame basis through a timevarying channel. The transmitted signal is corrupted by multiple access interference. Thesignal is further corrupted by AWGN at the front end <strong>of</strong> the receiver. Simple rake diversitycombining is employed at the receiver.We investigated the bit error rate at both uplink and downlink for two different timevarying channels. As expected the system is interference limited for higher number <strong>of</strong> users.We observed that without any channel coding schemes and antenna diversity techniques, theBER approaches to 10% as the system load goes beyond 50%. This is not an acceptableperformance. However the BER can be pushed back to an acceptable limit with channelcoding and antenna diversity techniques.The developed simulator can be an invaluable tool to investigate theperformance <strong>of</strong> a W<strong>CDMA</strong> under various conditions. As for example the simulator can beused to investigate antenna diversity schemes at the receiver. The simulator is very flexibleand one can very easily make the necessary modification to incorporate complex statistical70
channel model based on measurement and investigate the W<strong>CDMA</strong> performance underpractical mobile channel condition. We have shown that it is very simple to employ thesimulator to observe the performance <strong>of</strong> error correction coding. We implemented aconvolutional coding scheme for an uplink voice application <strong>of</strong> 9.6 kbps. It was observed thatchannel coding could significantly lower the required SNR for a particular BER.5.1 Future WorkThe simulator employs a simple rake receiver to exploit the gain arising from temporaldiversity. Spatial property <strong>of</strong> the multipath environment can be another source <strong>of</strong> diversity.Adaptive antennas are used at the receiver to take the advantage <strong>of</strong> this diversity gain. Thesimulator can be used to investigate the diversity gain <strong>of</strong> different adaptive algorithms.Space-Time rake receivers [21], [22] or 2-D rake receivers [23] have been proposed tocombine the temporal and spatial diversity at the receiver. Transmit diversity techniques[13], [14] at the downlink are gaining rapid popularity since they do not incur additionalhardware complexity at the mobile station. We are investigating various transmit diversityschemes and different 2- D rake receivers for the W<strong>CDMA</strong> system. The simulator wasmodified so that a large number <strong>of</strong> frames are transmitted rather than transmitting one frameat a time.Turbo coding has been specified for applications that require very low bit error rate.Turbo coding schemes can be incorporated to the simulator in the same way we employedconvolutional coding.The simulator can be further improved by using statistical channel models based onmeasured data. The improvement in system performance by using multi user detection andinterference cancellation can also be investigated.71
Bibliography[1] Malcom W. Oliphant, " The Mobile Phone Meets the Internet," IEEE Spectrum, pp. 20-28, August 1999.[2] Tero Ojanpera and Ramjee Prasad, "An Overview <strong>of</strong> Air Interface Multiple Access forIMT-2000/UMTS," IEEE Communications Magazine, vol. 36, pp. 88-95, September1998.[3] Erik Dahlman, Bjorn Gudmundson, Matts Nilsson, and Johan Skold, " UMTS/IMT-2000Based on Wideband <strong>CDMA</strong>," IEEE Communications Magazine, vol. 36, pp. 70-80,September 1998.[4] Erik Dahlman, Per Beming, Jens Knutsson, Fredrik Ovesjo, Magnus Persson, andChristiaan Roobol, " W<strong>CDMA</strong>- The Radio Interface for Future Mobile MultimediaCommunications," IEEE Transactions on Vehicular <strong>Tech</strong>nology, vol. 47, No. 4, pp.1105-1118, November 1998.[5] <strong>Third</strong> <strong>Generation</strong> Partnership Project <strong>Tech</strong>nical Specification Group Radio AccessNetwork Working Group 1," Spreading and Modulation," TS 25.213 V2.1.2 (1999-4).[6] <strong>Third</strong> <strong>Generation</strong> Partnership Project <strong>Tech</strong>nical Specification Group Radio AccessNetwork Working Group 1, " Physical Channels and Mapping <strong>of</strong> Transport Channelsonto Physical Channels (FDD)," TS 25.211 V2.2.1 (1999-08).72
[7] Kevin Laird, Nick Whinnet, and Soodesh Buljore, " A Peak-To-Average PowerReduction Method for <strong>Third</strong> <strong>Generation</strong> <strong>CDMA</strong> Reverse Links," in Proc., IEEEVehicular <strong>Tech</strong>nology Conference, 1999.[8] Esmael H. Dinan and Bijan Jabbari, "Spreading Codes for Direct Sequence <strong>CDMA</strong> andWideband <strong>CDMA</strong> Cellular Networks," IEEE Communications Magazine, vol. 36, pp. 48-54, September 1998.[9] T.S. Rappaport, Wireless Communications: Principles and Practice. Upper Saddle River,NJ: Prentice Hall PTR, 1996.[10] <strong>Third</strong> <strong>Generation</strong> Partnership Project <strong>Tech</strong>nical Specification Group Radio AccessNetwork Working Group 1, " Multiplexing and Channel Coding (FDD)," TS 25.212V2.0.1 (1999-08).[11] Alpha Concept Group, "Wideband Direct Sequence <strong>CDMA</strong> (W<strong>CDMA</strong>) EvaluationDocument (3.0)," Tdoc SMG 905/97, December 15-19, 1997, Madrid, Spain.[12] J. C. Liberti and T.S. Rappaport, Analysis <strong>of</strong> <strong>CDMA</strong> Cellular Radio <strong>Systems</strong> EmployingAdaptive Antennas. PhD dissertation, <strong>Virginia</strong> <strong>Tech</strong>, Blacksburg, VA, September 1995.[13] S.M. Alamouti, "A Simple Transmit Diversity <strong>Tech</strong>nique for WirelessCommunications," IEEE Journal on Selected Areas in Communications, vol. 16, pp.1451-1458, October 1998.[14] Texas Instruments, "Space Time Block Coded Transmit Antenna Diversity forW<strong>CDMA</strong>," ETSI SMG-2 UMTS-L1, TDOC 662/98.[15] <strong>Third</strong> <strong>Generation</strong> Partnership Project <strong>Tech</strong>nical Specification Group Radio AccessNetwork Working Group 1, " Physical Layer Procedures (FDD)," TS 25.214 V1.1.2(1999-08).73
[16] Commission <strong>of</strong> the European Communities, " Digital Land Mobile RadioCommunications: COST-207 Final Report," chapter 2, 1988.[17] W.C. Jakes, Microwave Mobile Communications. John Wiley and Sons, 1974.[18] R. Price and P.E. Green," A communications technique for multipath channels,"Proceedings <strong>of</strong> the IRE, vol. 2, pp. 555-570, March 1958.[19] J. G. Proakis, Digital Communications. New York, NY: McGraw-Hill Inc., third ed.,1995.[20] Roger L. Peterson, Rodger E. Ziemer, and David E. Broth, Introduction to SpreadSpectrum Communications. Englewood Cliffs, NJ: Prentice Hall, 1995.[21] Javier Ramos, Michael D. Zoltowski, and Hui Liu, "A Low-Complexity Space-TimeReceiver for DS-<strong>CDMA</strong> Communications," IEEE Signal Processing Letters, vol. 4, No.9, pp. 262-265, September 1997.[22] B. Xu, T.B. Vu, and H. Mehrpour, "A Space-Time Rake Receiver for AsynchronousDS-<strong>CDMA</strong> System Based on Smart Antenna," in Proc., IEEE Vehicular <strong>Tech</strong>nologyConference, 1999.[23] Babak h. Khalaj, Arogyaswami Paulraj, and Thomas Kailath, "2 D Rake Receivers for<strong>CDMA</strong> Cellular <strong>Systems</strong>," in Proc., IEEE Globecom Conference, pp. 400-404, 1994.74
VitaFakhrul Alam was born in Dhaka, Bangladesh on April 18, 1972. He received his B.Sc.Degree in Electrical and Electronic Engineering from Bangladesh University <strong>of</strong> Engineeringand <strong>Tech</strong>nology (BUET). He worked as a lecturer in the EEE Department <strong>of</strong> his alma materfor a year. He started in the M.S. program at <strong>Virginia</strong> <strong>Tech</strong> from the fall <strong>of</strong> 97 and joinedMPRG in the fall <strong>of</strong> 98.His research interests include Adaptive Receivers for Narrow andWide Band Modulation Schemes, Space-Time Coding and Wideband <strong>CDMA</strong> <strong>Systems</strong>. Hewill continue as a Ph.D. student with Dr. Brian D. Woerner from spring <strong>of</strong> 2000.75