Simulation of Third Generation CDMA Systems - Virginia Tech
Simulation of Third Generation CDMA Systems - Virginia Tech
Simulation of Third Generation CDMA Systems - Virginia Tech

You also want an ePaper? Increase the reach of your titles
YUMPU automatically turns print PDFs into web optimized ePapers that Google loves.
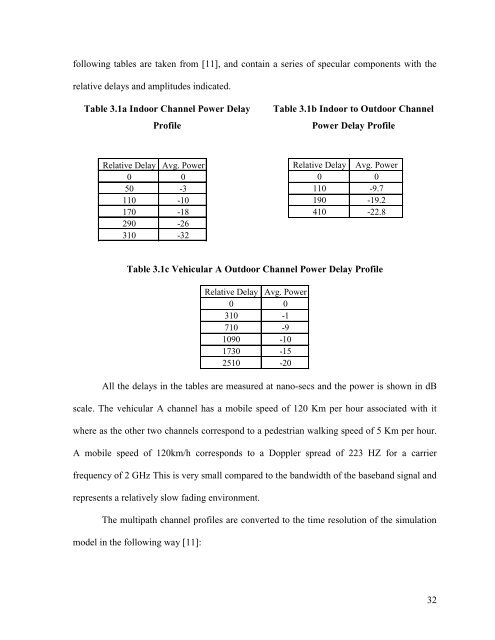
following tables are taken from [11], and contain a series <strong>of</strong> specular components with therelative delays and amplitudes indicated.Table 3.1a Indoor Channel Power DelayPr<strong>of</strong>ileTable 3.1b Indoor to Outdoor ChannelPower Delay Pr<strong>of</strong>ileRelative Delay Avg. Power0 050 -3110 -10170 -18290 -26310 -32Relative Delay Avg. Power0 0110 -9.7190 -19.2410 -22.8Table 3.1c Vehicular A Outdoor Channel Power Delay Pr<strong>of</strong>ileRelative Delay Avg. Power0 0310 -1710 -91090 -101730 -152510 -20All the delays in the tables are measured at nano-secs and the power is shown in dBscale. The vehicular A channel has a mobile speed <strong>of</strong> 120 Km per hour associated with itwhere as the other two channels correspond to a pedestrian walking speed <strong>of</strong> 5 Km per hour.A mobile speed <strong>of</strong> 120km/h corresponds to a Doppler spread <strong>of</strong> 223 HZ for a carrierfrequency <strong>of</strong> 2 GHz This is very small compared to the bandwidth <strong>of</strong> the baseband signal andrepresents a relatively slow fading environment.The multipath channel pr<strong>of</strong>iles are converted to the time resolution <strong>of</strong> the simulationmodel in the following way [11]:32