Zhone Technologies Annual Report 2004
Zhone Technologies Annual Report 2004
Zhone Technologies Annual Report 2004

You also want an ePaper? Increase the reach of your titles
YUMPU automatically turns print PDFs into web optimized ePapers that Google loves.
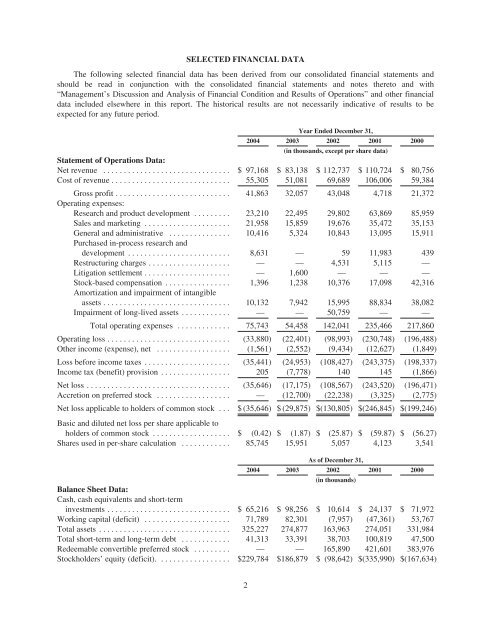
SELECTED FINANCIAL DATA<br />
The following selected financial data has been derived from our consolidated financial statements and<br />
should be read in conjunction with the consolidated financial statements and notes thereto and with<br />
“Management’s Discussion and Analysis of Financial Condition and Results of Operations” and other financial<br />
data included elsewhere in this report. The historical results are not necessarily indicative of results to be<br />
expected for any future period.<br />
Year Ended December 31,<br />
<strong>2004</strong> 2003 2002 2001 2000<br />
(in thousands, except per share data)<br />
Statement of Operations Data:<br />
Net revenue ............................... $ 97,168 $ 83,138 $ 112,737 $ 110,724 $ 80,756<br />
Cost of revenue ............................. 55,305 51,081 69,689 106,006 59,384<br />
Gross profit ............................ 41,863 32,057 43,048 4,718 21,372<br />
Operating expenses:<br />
Research and product development ......... 23,210 22,495 29,802 63,869 85,959<br />
Sales and marketing ..................... 21,958 15,859 19,676 35,472 35,153<br />
General and administrative ............... 10,416 5,324 10,843 13,095 15,911<br />
Purchased in-process research and<br />
development ......................... 8,631 — 59 11,983 439<br />
Restructuring charges .................... — — 4,531 5,115 —<br />
Litigation settlement ..................... — 1,600 — — —<br />
Stock-based compensation ................ 1,396 1,238 10,376 17,098 42,316<br />
Amortization and impairment of intangible<br />
assets ............................... 10,132 7,942 15,995 88,834 38,082<br />
Impairment of long-lived assets ............ — — 50,759 — —<br />
Total operating expenses ............. 75,743 54,458 142,041 235,466 217,860<br />
Operating loss .............................. (33,880) (22,401) (98,993) (230,748) (196,488)<br />
Other income (expense), net .................. (1,561) (2,552) (9,434) (12,627) (1,849)<br />
Loss before income taxes ..................... (35,441) (24,953) (108,427) (243,375) (198,337)<br />
Income tax (benefit) provision ................. 205 (7,778) 140 145 (1,866)<br />
Net loss ................................... (35,646) (17,175) (108,567) (243,520) (196,471)<br />
Accretion on preferred stock .................. — (12,700) (22,238) (3,325) (2,775)<br />
Net loss applicable to holders of common stock . . . $ (35,646) $ (29,875) $(130,805) $(246,845) $(199,246)<br />
Basic and diluted net loss per share applicable to<br />
holders of common stock ................... $ (0.42) $ (1.87) $ (25.87) $ (59.87) $ (56.27)<br />
Shares used in per-share calculation ............ 85,745 15,951 5,057 4,123 3,541<br />
As of December 31,<br />
<strong>2004</strong> 2003 2002 2001 2000<br />
(in thousands)<br />
Balance Sheet Data:<br />
Cash, cash equivalents and short-term<br />
investments .............................. $ 65,216 $ 98,256 $ 10,614 $ 24,137 $ 71,972<br />
Working capital (deficit) ..................... 71,789 82,301 (7,957) (47,361) 53,767<br />
Total assets ................................ 325,227 274,877 163,963 274,051 331,984<br />
Total short-term and long-term debt ............ 41,313 33,391 38,703 100,819 47,500<br />
Redeemable convertible preferred stock ......... — — 165,890 421,601 383,976<br />
Stockholders’ equity (deficit). ................. $229,784 $186,879 $ (98,642) $(335,990) $(167,634)<br />
2