
You also want an ePaper? Increase the reach of your titles
YUMPU automatically turns print PDFs into web optimized ePapers that Google loves.
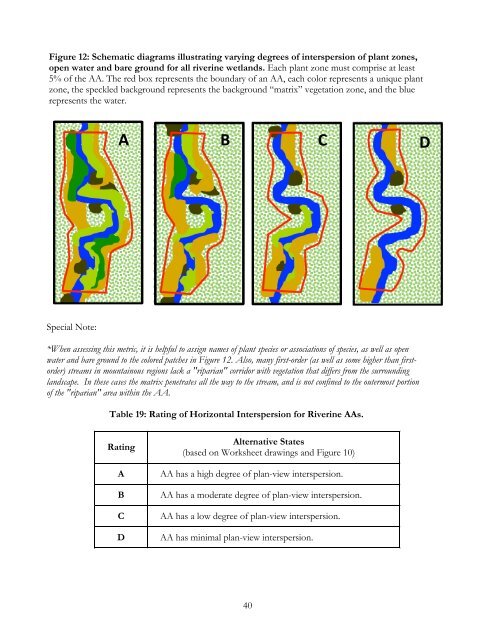
Figure 12: Schematic diagrams illustrating varying degrees of interspersion of plant zones,<br />
open water and bare ground for all riverine wetlands. Each plant zone must comprise at least<br />
5% of the AA. The red box represents the boundary of an AA, each color represents a unique plant<br />
zone, the speckled background represents the background “matrix” vegetation zone, and the blue<br />
represents the water.<br />
A <br />
B <br />
C <br />
D <br />
Special Note:<br />
*When assessing this metric, it is helpful to assign names of plant species or associations of species, as well as open<br />
water and bare ground to the colored patches in Figure 12. Also, many first-order (as well as some higher than firstorder)<br />
streams in mountainous regions lack a "riparian" corridor with vegetation that differs from the surrounding<br />
landscape. In these cases the matrix penetrates all the way to the stream, and is not confined to the outermost portion<br />
of the "riparian" area within the AA.<br />
Table 19: Rating of Horizontal Interspersion for Riverine AAs.<br />
Rating<br />
A<br />
B<br />
C<br />
D<br />
Alternative States<br />
(based on Worksheet drawings and Figure 10)<br />
AA has a high degree of plan-view interspersion.<br />
AA has a moderate degree of plan-view interspersion.<br />
AA has a low degree of plan-view interspersion.<br />
AA has minimal plan-view interspersion.<br />
40