KI Traveller's Levy Economic Impact Assessment - Kangaroo Island ...
KI Traveller's Levy Economic Impact Assessment - Kangaroo Island ...
KI Traveller's Levy Economic Impact Assessment - Kangaroo Island ...

You also want an ePaper? Increase the reach of your titles
YUMPU automatically turns print PDFs into web optimized ePapers that Google loves.
Commercial-in-Confidence<br />
<strong>KI</strong> Traveller’s <strong>Levy</strong><br />
<strong>Impact</strong> <strong>Assessment</strong><br />
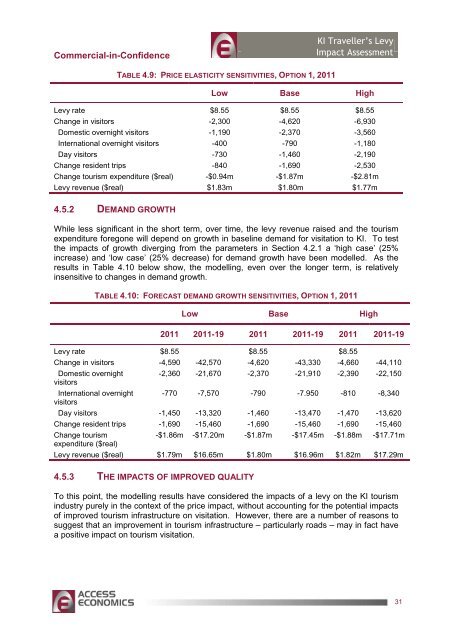
TABLE 4.9: PRICE ELASTICITY SENSITIVITIES, OPTION 1, 2011<br />
Low Base High<br />
<strong>Levy</strong> rate $8.55 $8.55 $8.55<br />
Change in visitors -2,300 -4,620 -6,930<br />
Domestic overnight visitors -1,190 -2,370 -3,560<br />
International overnight visitors -400 -790 -1,180<br />
Day visitors -730 -1,460 -2,190<br />
Change resident trips -840 -1,690 -2,530<br />
Change tourism expenditure ($real) -$0.94m -$1.87m -$2.81m<br />
<strong>Levy</strong> revenue ($real) $1.83m $1.80m $1.77m<br />
4.5.2 DEMAND GROWTH<br />
While less significant in the short term, over time, the levy revenue raised and the tourism<br />
expenditure foregone will depend on growth in baseline demand for visitation to <strong>KI</strong>. To test<br />
the impacts of growth diverging from the parameters in Section 4.2.1 a ‘high case’ (25%<br />
increase) and ‘low case’ (25% decrease) for demand growth have been modelled. As the<br />
results in Table 4.10 below show, the modelling, even over the longer term, is relatively<br />
insensitive to changes in demand growth.<br />
TABLE 4.10: FORECAST DEMAND GROWTH SENSITIVITIES, OPTION 1, 2011<br />
Low Base High<br />
2011 2011-19 2011 2011-19 2011 2011-19<br />
<strong>Levy</strong> rate $8.55 $8.55 $8.55<br />
Change in visitors -4,590 -42,570 -4,620 -43,330 -4,660 -44,110<br />
Domestic overnight<br />
visitors<br />
International overnight<br />
visitors<br />
-2,360 -21,670 -2,370 -21,910 -2,390 -22,150<br />
-770 -7,570 -790 -7.950 -810 -8,340<br />
Day visitors -1,450 -13,320 -1,460 -13,470 -1,470 -13,620<br />
Change resident trips -1,690 -15,460 -1,690 -15,460 -1,690 -15,460<br />
Change tourism<br />
expenditure ($real)<br />
-$1.86m -$17.20m -$1.87m -$17.45m -$1.88m -$17.71m<br />
<strong>Levy</strong> revenue ($real) $1.79m $16.65m $1.80m $16.96m $1.82m $17.29m<br />
4.5.3 THE IMPACTS OF IMPROVED QUALITY<br />
To this point, the modelling results have considered the impacts of a levy on the <strong>KI</strong> tourism<br />
industry purely in the context of the price impact, without accounting for the potential impacts<br />
of improved tourism infrastructure on visitation. However, there are a number of reasons to<br />
suggest that an improvement in tourism infrastructure – particularly roads – may in fact have<br />
a positive impact on tourism visitation.<br />
31