Fremantle Port Inner Harbour and Channel ... - Fremantle Ports
Fremantle Port Inner Harbour and Channel ... - Fremantle Ports
Fremantle Port Inner Harbour and Channel ... - Fremantle Ports

Create successful ePaper yourself
Turn your PDF publications into a flip-book with our unique Google optimized e-Paper software.
4. Environmental Quality Indicators <strong>and</strong> Targets<br />
4.1. Water Quality<br />
4.1.1. Ecosystem Health (EQO1: Maintenance of Ecosystem Integrity)<br />
Light requirements for Seagrass <strong>and</strong> Coral Health<br />
Water quality triggers will be based on light attenuation in the water column, related to the<br />
minimum light requirements (MLR) of seagrass <strong>and</strong> corals, as described in the DSDMP<br />
(<strong>Fremantle</strong> <strong>Port</strong>s, 2009). Specifically, the Light Attenuation Coefficient (LAC), a measure of<br />
the attenuation of light with depth through the water column, will be assessed against trigger<br />
values that are specific to depth, habitat (seagrass or corals) <strong>and</strong> BPPH management zones.<br />
The higher the LAC, the less light that can penetrate the water column to reach<br />
photosynthesising BPP, such as seagrass <strong>and</strong> corals.<br />
Water quality triggers for each level of management response (see Section 5.1.1 – Seagrass<br />
<strong>and</strong> Coral Health) are based on a stepwise percentage increase above the LAC that was used<br />
to determine the inner boundary of the BPPH management zone being monitored. The<br />
predicted Zone of Loss (ZoL) is not included in management response, since any BPPH within<br />
the ZoL is assumed to be lost through physical disturbance (within the dredging <strong>and</strong> disposal<br />
footprints) or high turbidity <strong>and</strong> sedimentation immediately adjacent to Project activities.<br />
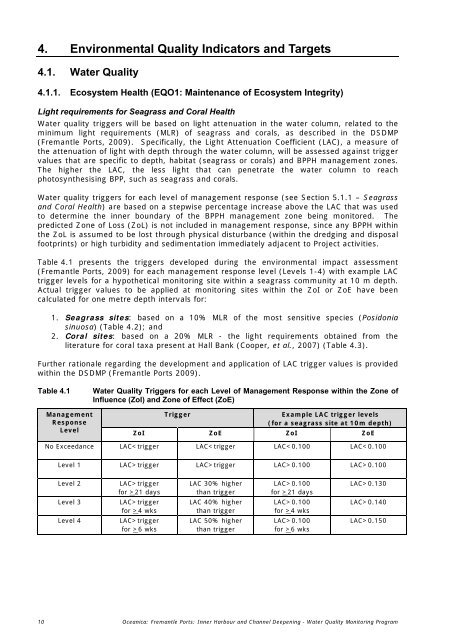
Table 4.1 presents the triggers developed during the environmental impact assessment<br />
(<strong>Fremantle</strong> <strong>Port</strong>s, 2009) for each management response level (Levels 1-4) with example LAC<br />
trigger levels for a hypothetical monitoring site within a seagrass community at 10 m depth.<br />
Actual trigger values to be applied at monitoring sites within the ZoI or ZoE have been<br />
calculated for one metre depth intervals for:<br />
1. Seagrass sites: based on a 10% MLR of the most sensitive species (Posidonia<br />
sinuosa) (Table 4.2); <strong>and</strong><br />
2. Coral sites: based on a 20% MLR - the light requirements obtained from the<br />
literature for coral taxa present at Hall Bank (Cooper, et al., 2007) (Table 4.3).<br />
Further rationale regarding the development <strong>and</strong> application of LAC trigger values is provided<br />
within the DSDMP (<strong>Fremantle</strong> <strong>Port</strong>s 2009).<br />
Table 4.1<br />
Water Quality Triggers for each Level of Management Response within the Zone of<br />
Influence (ZoI) <strong>and</strong> Zone of Effect (ZoE)<br />
Management<br />
Response<br />
Level<br />
Trigger<br />
Example LAC trigger levels<br />
(for a seagrass site at 10m depth)<br />
ZoI ZoE ZoI ZoE<br />
No Exceedance LAC0.100<br />
Level 2<br />
Level 3<br />
Level 4<br />
LAC>trigger<br />
for >21 days<br />
LAC>trigger<br />
for >4 wks<br />
LAC>trigger<br />
for >6 wks<br />
LAC 30% higher<br />
than trigger<br />
LAC 40% higher<br />
than trigger<br />
LAC 50% higher<br />
than trigger<br />
LAC>0.100<br />
for >21 days<br />
LAC>0.100<br />
for >4 wks<br />
LAC>0.100<br />
for >6 wks<br />
LAC>0.130<br />
LAC>0.140<br />
LAC>0.150<br />
10 Oceanica: <strong>Fremantle</strong> <strong>Port</strong>s: <strong>Inner</strong> <strong>Harbour</strong> <strong>and</strong> <strong>Channel</strong> Deepening - Water Quality Monitoring Program