

Download PDF - Kumba Iron Ore
Download PDF - Kumba Iron Ore
Download PDF - Kumba Iron Ore

Create successful ePaper yourself
Turn your PDF publications into a flip-book with our unique Google optimized e-Paper software.
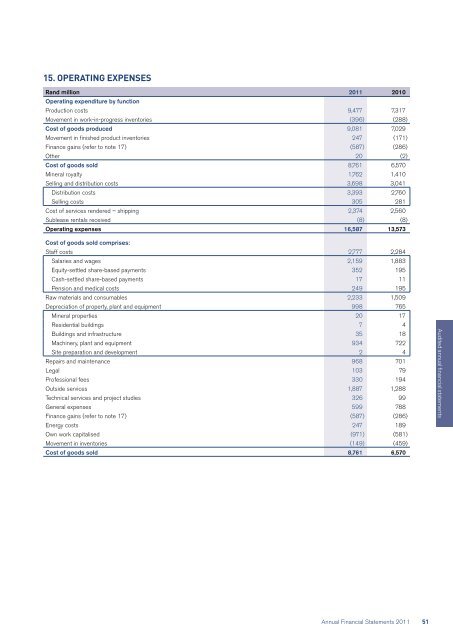
15. OPERATING EXPENSES<br />
Rand million 2011 2010<br />
Operating expenditure by function<br />
Production costs 9,477 7,317<br />
Movement in work-in-progress inventories (396) (288)<br />
Cost of goods produced 9,081 7,029<br />
Movement in finished product inventories 247 (171)<br />
Finance gains (refer to note 17) (587) (286)<br />
Other 20 (2)<br />
Cost of goods sold 8,761 6,570<br />
Mineral royalty 1,762 1,410<br />
Selling and distribution costs 3,698 3,041<br />
Distribution costs 3,393 2,760<br />
Selling costs 305 281<br />
Cost of services rendered – shipping 2,374 2,560<br />
Sublease rentals received (8) (8)<br />
Operating expenses 16,587 13,573<br />
Cost of goods sold comprises:<br />
Staff costs 2,777 2,284<br />
Salaries and wages 2,159 1,883<br />
Equity-settled share-based payments 352 195<br />
Cash-settled share-based payments 17 11<br />
Pension and medical costs 249 195<br />
Raw materials and consumables 2,233 1,509<br />
Depreciation of property, plant and equipment 998 765<br />
Mineral properties 20 17<br />
Residential buildings 7 4<br />
Buildings and infrastructure 35 18<br />
Machinery, plant and equipment 934 722<br />
Site preparation and development 2 4<br />
Repairs and maintenance 968 701<br />
Legal 103 79<br />
Professional fees 330 194<br />
Outside services 1,887 1,288<br />
Technical services and project studies 326 99<br />
General expenses 599 788<br />
Finance gains (refer to note 17) (587) (286)<br />
Energy costs 247 189<br />
Own work capitalised (971) (581)<br />
Movement in inventories (149) (459)<br />
Cost of goods sold 8,761 6,570<br />
Audited annual financial statements<br />
Annual Financial Statements 2011<br />
51


![English PDF [ 189KB ] - Anglo American](https://img.yumpu.com/50470814/1/184x260/english-pdf-189kb-anglo-american.jpg?quality=85)


![pdf [ 595KB ] - Anglo American](https://img.yumpu.com/49420483/1/184x260/pdf-595kb-anglo-american.jpg?quality=85)
![pdf [ 1.1MB ] - Anglo American](https://img.yumpu.com/49057963/1/190x240/pdf-11mb-anglo-american.jpg?quality=85)

