Economic Impacts of the Green Industry in the - Urban Forest ...
Economic Impacts of the Green Industry in the - Urban Forest ...
Economic Impacts of the Green Industry in the - Urban Forest ...

You also want an ePaper? Increase the reach of your titles
YUMPU automatically turns print PDFs into web optimized ePapers that Google loves.
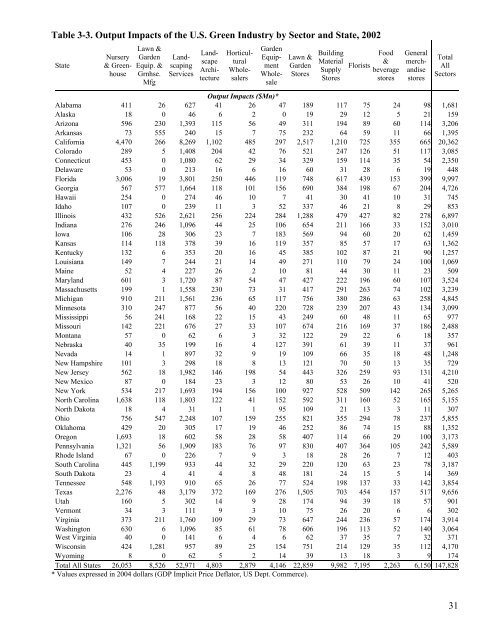
Table 3-3. Output <strong>Impacts</strong> <strong>of</strong> <strong>the</strong> U.S. <strong>Green</strong> <strong>Industry</strong> by Sector and State, 2002<br />
State<br />
Lawn &<br />
Garden<br />
Equip. &<br />
Grnhse.<br />
Mfg<br />
Nursery<br />
& <strong>Green</strong>house<br />
Landscap<strong>in</strong>g<br />
Services<br />
Landscape<br />
Architecture<br />
Horticultural<br />
Wholesalers<br />
Garden<br />
Equipment<br />
Wholesale<br />
Lawn &<br />
Garden<br />
Stores<br />
Build<strong>in</strong>g<br />
Material<br />
Supply<br />
Stores<br />
Florists<br />
Food<br />
&<br />
beverage<br />
stores<br />
General<br />
merchandise<br />
stores<br />
Total<br />
All<br />
Sectors<br />
Output <strong>Impacts</strong> ($Mn)*<br />
Alabama 411 26 627 41 26 47 189 117 75 24 98 1,681<br />
Alaska 18 0 46 6 2 0 19 29 12 5 21 159<br />
Arizona 596 230 1,393 115 56 49 311 194 89 60 114 3,206<br />
Arkansas 73 555 240 15 7 75 232 64 59 11 66 1,395<br />
California 4,470 266 8,269 1,102 485 297 2,517 1,210 725 355 665 20,362<br />
Colorado 289 5 1,408 204 42 76 521 247 126 51 117 3,085<br />
Connecticut 453 0 1,080 62 29 34 329 159 114 35 54 2,350<br />
Delaware 53 0 213 16 6 16 60 31 28 6 19 448<br />
Florida 3,006 19 3,801 250 446 119 748 617 439 153 399 9,997<br />
Georgia 567 577 1,664 118 101 156 690 384 198 67 204 4,726<br />
Hawaii 254 0 274 46 10 7 41 30 41 10 31 745<br />
Idaho 107 0 239 11 3 52 337 46 21 8 29 853<br />
Ill<strong>in</strong>ois 432 526 2,621 256 224 284 1,288 479 427 82 278 6,897<br />
Indiana 276 246 1,096 44 25 106 654 211 166 33 152 3,010<br />
Iowa 106 28 306 23 7 183 569 94 60 20 62 1,459<br />
Kansas 114 118 378 39 16 119 357 85 57 17 63 1,362<br />
Kentucky 132 6 353 20 16 45 385 102 87 21 90 1,257<br />
Louisiana 149 7 244 21 14 49 271 110 79 24 100 1,069<br />
Ma<strong>in</strong>e 52 4 227 26 2 10 81 44 30 11 23 509<br />
Maryland 601 3 1,720 87 54 47 427 222 196 60 107 3,524<br />
Massachusetts 199 1 1,558 230 73 31 417 291 263 74 102 3,239<br />
Michigan 910 211 1,561 236 65 117 756 380 286 63 258 4,845<br />
M<strong>in</strong>nesota 310 247 877 56 40 220 728 239 207 43 134 3,099<br />
Mississippi 56 241 168 22 15 43 249 60 48 11 65 977<br />
Missouri 142 221 676 27 33 107 674 216 169 37 186 2,488<br />
Montana 57 0 62 6 3 32 122 29 22 6 18 357<br />
Nebraska 40 35 199 16 4 127 391 61 39 11 37 961<br />
Nevada 14 1 897 32 9 19 109 66 35 18 48 1,248<br />
New Hampshire 101 3 298 18 8 13 121 70 50 13 35 729<br />
New Jersey 562 18 1,982 146 198 54 443 326 259 93 131 4,210<br />
New Mexico 87 0 184 23 3 12 80 53 26 10 41 520<br />
New York 534 217 1,693 194 156 100 927 528 509 142 265 5,265<br />
North Carol<strong>in</strong>a 1,638 118 1,803 122 41 152 592 311 160 52 165 5,155<br />
North Dakota 18 4 31 1 1 95 109 21 13 3 11 307<br />
Ohio 756 547 2,248 107 159 255 821 355 294 78 237 5,855<br />
Oklahoma 429 20 305 17 19 46 252 86 74 15 88 1,352<br />
Oregon 1,693 18 602 58 28 58 407 114 66 29 100 3,173<br />
Pennsylvania 1,321 56 1,909 183 76 97 830 407 364 105 242 5,589<br />
Rhode Island 67 0 226 7 9 3 18 28 26 7 12 403<br />
South Carol<strong>in</strong>a 445 1,199 933 44 32 29 220 120 63 23 78 3,187<br />
South Dakota 23 4 41 4 8 48 181 24 15 5 14 369<br />
Tennessee 548 1,193 910 65 26 77 524 198 137 33 142 3,854<br />
Texas 2,276 48 3,179 372 169 276 1,505 703 454 157 517 9,656<br />
Utah 160 5 302 14 9 28 174 94 39 18 57 901<br />
Vermont 34 3 111 9 3 10 75 26 20 6 6 302<br />
Virg<strong>in</strong>ia 373 211 1,760 109 29 73 647 244 236 57 174 3,914<br />
Wash<strong>in</strong>gton 630 6 1,096 85 61 78 606 196 113 52 140 3,064<br />
West Virg<strong>in</strong>ia 40 0 141 6 4 6 62 37 35 7 32 371<br />
Wiscons<strong>in</strong> 424 1,281 957 89 25 154 751 214 129 35 112 4,170<br />
Wyom<strong>in</strong>g 8 0 62 5 2 14 39 13 18 3 9 174<br />
Total All States 26,053 8,526 52,971 4,803 2,879 4,146 22,859 9,982 7,195 2,263 6,150 147,828<br />
* Values expressed <strong>in</strong> 2004 dollars (GDP Implicit Price Deflator, US Dept. Commerce).<br />
31