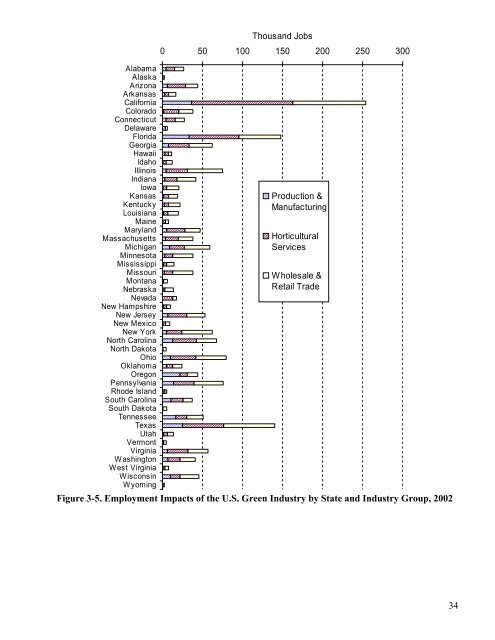
Alabama Alaska Arizona Arkansas California Colorado Connecticut Delaware Florida Georgia Hawaii Idaho Ill<strong>in</strong>ois Indiana Iowa Kansas Kentucky Louisiana Ma<strong>in</strong>e Maryland Massachusetts Michigan M<strong>in</strong>nesota Mississippi Missouri Montana Nebraska Nevada New Hampshire New Jersey New Mexico New York North Carol<strong>in</strong>a North Dakota Ohio Oklahoma Oregon Pennsylvania Rhode Island South Carol<strong>in</strong>a South Dakota Tennessee Texas Utah Vermont Virg<strong>in</strong>ia Wash<strong>in</strong>gton West Virg<strong>in</strong>ia Wiscons<strong>in</strong> Wyom<strong>in</strong>g Thousand Jobs 0 50 100 150 200 250 300 Production & Manufactur<strong>in</strong>g Horticultural Services Wholesale & Retail Trade Figure 3-5. Employment <strong>Impacts</strong> <strong>of</strong> <strong>the</strong> U.S. <strong>Green</strong> <strong>Industry</strong> by State and <strong>Industry</strong> Group, 2002 34
Table 3-5. Value Added <strong>Impacts</strong> <strong>of</strong> <strong>the</strong> U.S. <strong>Green</strong> <strong>Industry</strong> by Sector and State, 2002 Lawn & Garden State Equip. & Grnhse. Mfg Nursery & <strong>Green</strong>house <strong>Green</strong>house Mfg Landscap<strong>in</strong>g Services Landscape Architecture Horticultural Wholesalers Garden Equipment Wholesale Lawn & Garden Stores Build<strong>in</strong>g Material Florists Supply Stores Food & beverage stores General merchandise stores Total All Sectors Value Added <strong>Impacts</strong> ($Mn)* Alabama 345 9 4 405 29 17 31 122 75 38 14 63 1,148 Alaska 10 0 0 31 5 1 0 13 19 6 3 14 104 Arizona 435 71 2 929 84 37 32 204 127 51 38 74 2,081 Arkansas 58 137 2 154 11 4 49 146 40 28 6 41 675 California 3,079 86 10 5,644 785 324 199 1,657 797 424 226 437 13,656 Colorado 177 2 1 939 144 28 50 340 161 70 32 76 2,019 Connecticut 375 0 0 742 46 19 23 223 107 66 23 36 1,659 Delaware 44 0 0 138 11 4 10 39 20 15 4 13 297 Florida 2,456 7 5 2,562 185 294 79 488 402 251 92 259 7,076 Georgia 468 176 5 1,127 86 67 103 453 252 113 41 133 3,020 Hawaii 200 0 0 186 33 7 5 28 21 24 7 21 531 Idaho 91 0 0 156 8 2 34 220 30 10 5 19 576 Ill<strong>in</strong>ois 268 162 7 1,786 186 147 187 826 308 238 50 177 4,335 Indiana 156 73 4 714 32 17 70 412 133 84 19 95 1,804 Iowa 53 10 2 199 17 5 121 362 60 30 12 39 906 Kansas 55 39 1 246 27 11 79 225 53 29 10 40 813 Kentucky 110 2 1 230 15 11 30 245 65 44 12 57 821 Louisiana 97 3 2 158 15 9 32 174 71 42 14 64 679 Ma<strong>in</strong>e 38 1 1 147 18 2 7 53 29 15 7 15 331 Maryland 477 1 0 1,166 64 37 31 288 150 115 39 72 2,440 Massachusetts 122 0 0 1,062 163 49 21 279 194 155 46 68 2,159 Michigan 479 85 2 1,060 161 43 77 485 244 155 38 164 2,991 M<strong>in</strong>nesota 154 84 1 576 40 26 145 464 152 112 26 85 1,864 Mississippi 52 68 2 106 16 10 28 158 38 24 7 41 548 Missouri 77 57 3 450 20 22 71 430 138 89 22 118 1,495 Montana 31 0 0 39 4 2 21 78 18 11 3 12 219 Nebraska 18 13 6 129 12 3 84 248 39 20 7 23 596 Nevada 13 1 1 610 23 6 13 73 44 20 11 32 844 New Hampshire 61 2 2 195 13 5 8 79 45 27 8 22 465 New Jersey 430 6 1 1,354 105 133 36 297 218 150 58 87 2,875 New Mexico 72 0 0 121 17 2 8 53 34 14 6 27 353 New York 374 64 2 1,219 144 105 67 621 354 298 89 177 3,511 North Carol<strong>in</strong>a 1,347 40 5 1,173 88 27 101 382 201 87 31 106 3,583 North Dakota 8 1 0 20 1 1 61 69 14 6 2 7 189 Ohio 436 171 3 1,479 77 101 163 524 226 159 46 150 3,532 Oklahoma 241 6 1 199 13 12 31 159 54 38 9 56 819 Oregon 1,043 5 1 406 42 19 38 265 74 36 18 66 2,010 Pennsylvania 904 20 3 1,300 130 50 65 531 260 195 63 154 3,672 Rhode Island 41 0 0 151 5 6 2 12 19 14 5 8 262 South Carol<strong>in</strong>a 394 353 1 606 32 21 19 143 78 33 14 50 1,745 South Dakota 12 2 1 25 3 6 32 114 15 7 3 9 228 Tennessee 301 387 5 603 46 17 51 335 127 73 20 91 2,050 Texas 1,340 20 18 2,086 264 111 181 962 449 247 94 332 6,088 Utah 128 2 1 195 10 6 18 111 60 21 10 37 600 Vermont 24 1 0 72 6 2 7 49 17 10 4 4 196 Virg<strong>in</strong>ia 248 60 1 1,170 80 20 48 427 161 130 35 115 2,493 Wash<strong>in</strong>gton 480 2 1 734 61 41 52 397 128 61 33 92 2,080 West Virg<strong>in</strong>ia 13 0 0 92 4 3 4 39 24 17 4 20 220 Wiscons<strong>in</strong> 238 492 3 633 64 17 102 478 136 66 20 70 2,317 Wyom<strong>in</strong>g 4 0 0 40 4 1 9 25 8 9 2 6 109 Total All States 18,076 2,720 110 35,564 3,449 1,907 2,737 14,806 6,491 3,977 1,385 3,973 95,084 * Values expressed <strong>in</strong> 2004 dollars (GDP Implicit Price Deflator, US Dept. Commerce). 35