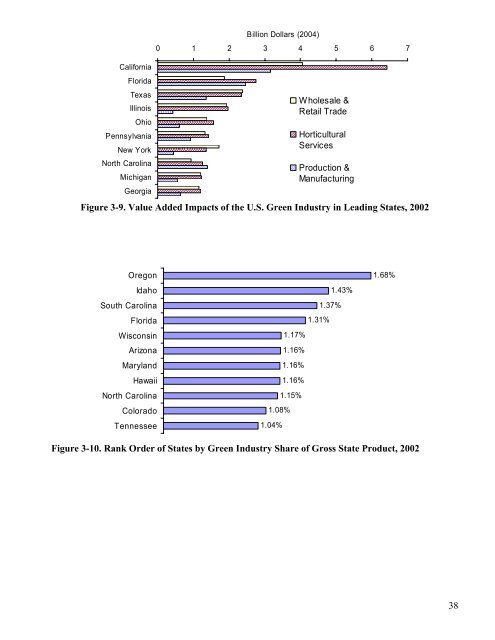
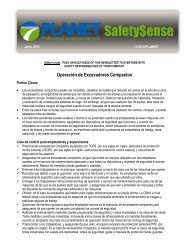
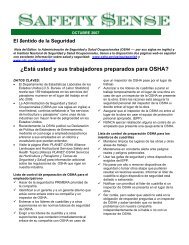
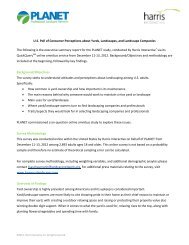
California Florida Texas Ill<strong>in</strong>ois Ohio Pennsylvania New York North Carol<strong>in</strong>a Michigan Georgia Billion Dollars (2004) 0 1 2 3 4 5 6 7 Wholesale & Retail Trade Horticultural Services Production & Manufactur<strong>in</strong>g Figure 3-9. Value Added <strong>Impacts</strong> <strong>of</strong> <strong>the</strong> U.S. <strong>Green</strong> <strong>Industry</strong> <strong>in</strong> Lead<strong>in</strong>g States, 2002 Oregon Idaho South Carol<strong>in</strong>a Florida Wiscons<strong>in</strong> Arizona Maryland Hawaii North Carol<strong>in</strong>a Colorado Tennessee 1.43% 1.37% 1.31% 1.17% 1.16% 1.16% 1.16% 1.15% 1.08% 1.04% 1.68% Figure 3-10. Rank Order <strong>of</strong> States by <strong>Green</strong> <strong>Industry</strong> Share <strong>of</strong> Gross State Product, 2002 38
Table 3-6. <strong>Green</strong> <strong>Industry</strong> Share <strong>of</strong> Gross State Product, 2002 State Total Value Added Gross State <strong>Green</strong> <strong>Industry</strong> Impact <strong>of</strong> <strong>Green</strong> Product (Mn$)* Share <strong>of</strong> GSP <strong>Industry</strong> (Mn$)* Alabama 1,148 130,678 0.878% Alaska 104 30,917 0.336% Arizona 2,081 178,773 1.164% Arkansas 676 74,857 0.902% California 13,656 1,423,454 0.959% Colorado 2,019 186,712 1.081% Connecticut 1,659 172,490 0.962% Delaware 297 49,069 0.606% Florida 7,076 541,684 1.306% Georgia 3,020 318,276 0.949% Hawaii 531 45,789 1.160% Idaho 576 40,127 1.434% Ill<strong>in</strong>ois 4,335 505,925 0.857% Indiana 1,804 213,287 0.846% Iowa 906 102,230 0.886% Kansas 813 93,151 0.873% Kentucky 821 127,259 0.645% Louisiana 679 136,940 0.496% Ma<strong>in</strong>e 331 40,628 0.815% Maryland 2,440 210,096 1.161% Massachusetts 2,159 299,813 0.720% Michigan 2,991 365,584 0.818% M<strong>in</strong>nesota 1,864 208,204 0.895% Mississippi 548 71,950 0.761% Missouri 1,495 195,176 0.766% Montana 219 24,741 0.886% Nebraska 596 63,443 0.940% Nevada 844 84,486 0.999% New Hampshire 465 48,338 0.962% New Jersey 2,875 395,642 0.727% New Mexico 353 55,693 0.635% New York 3,511 824,295 0.426% North Carol<strong>in</strong>a 3,583 312,435 1.147% North Dakota 189 20,585 0.920% Ohio 3,532 404,025 0.874% Oklahoma 819 98,998 0.827% Oregon 2,010 119,824 1.678% Pennsylvania 3,672 446,408 0.823% Rhode Island 262 38,493 0.682% South Carol<strong>in</strong>a 1,745 127,334 1.370% South Dakota 228 26,0201 0.877% Tennessee 2,050 197,860 1.036% Texas 6,088 804,935 0.756% Utah 600 75,944 0.790% Vermont 196 20,402 0.961% Virg<strong>in</strong>ia 2,493 299,294 0.833% Wash<strong>in</strong>gton 2,080 242,421 0.858% West Virg<strong>in</strong>ia 220 47,371 0.464% Wiscons<strong>in</strong> 2,317 198,410 1.168% Wyom<strong>in</strong>g 109 21,111 0.517% Total All States 95,084 10,830,712 0.878% * Expressed <strong>in</strong> 2004 dollars us<strong>in</strong>g GDP Implicit Price Deflator. Source for GSP: U.S. Dept. Commerce, Bureau <strong>of</strong> <strong>Economic</strong> Analysis 39