Transactions A.S.M.E.
Transactions A.S.M.E.
Transactions A.S.M.E.

Create successful ePaper yourself
Turn your PDF publications into a flip-book with our unique Google optimized e-Paper software.
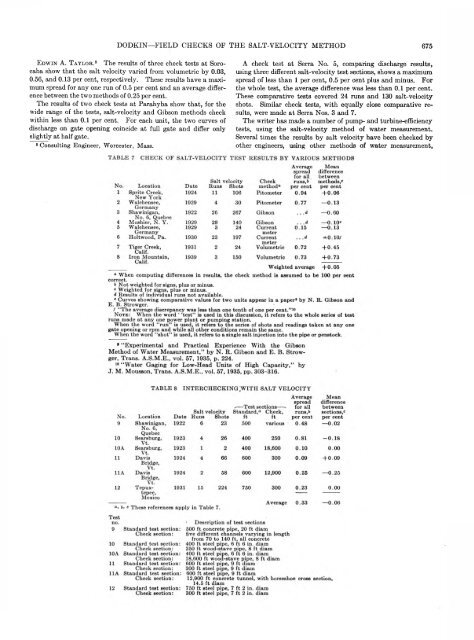
DODKIN—FIELD CHECKS OF THE SALT-VELOCITY METHOD 675<br />
E d w i n A. T a y l o r .8 The results of three check tests at Sorocaba<br />
show that the salt velocity varied from volumetric by 0.03,<br />
0.56, and 0.13 per cent, respectively. These results have a maximum<br />
spread for any one run of 0.5 per cent and an average difference<br />
between the two methods of 0.25 per cent.<br />
The results of two check tests at Parahyba show that, for the<br />
wide range of the tests, salt-velocity and Gibson methods check<br />
within less than 0.1 per cent. For each unit, the two curves of<br />
discharge on gate opening coincide at full gate and differ only<br />
slightly at half gate.<br />
8 Consulting Engineer, W orcester, Mass.<br />
A check test at Serra No. 5, comparing discharge results,<br />
using three different salt-velocity test sections, shows a maximum<br />
spread of less than 1 per cent, 0.5 per cent plus and minus. For<br />
the whole test, the average difference was less than 0.1 per cent.<br />
These comparative tests covered 24 runs and 130 salt-velocity<br />
shots. Similar check tests, with equally close comparative results,<br />
were made at Serra Nos. 3 and 7.<br />
The writer has made a number of pump- and turbine-efficiency<br />
tests, using the salt-velocity method of water measurement.<br />
Several times the results by salt velocity have been checked by<br />
other engineers, using other methods of water measurement,