


Space Utilization Study for Academic Spaces - Facilities - Wake ...
Space Utilization Study for Academic Spaces - Facilities - Wake ...
Space Utilization Study for Academic Spaces - Facilities - Wake ...

Create successful ePaper yourself
Turn your PDF publications into a flip-book with our unique Google optimized e-Paper software.
<strong>Wake</strong> Forest <strong>Space</strong> <strong>Utilization</strong> <strong>Study</strong><br />
Project Scope and Summation of Findings<br />
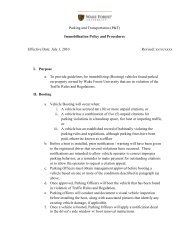
Chart 1: Current and Projected Personnel<br />
2,400<br />
2,250<br />
2,100<br />
1,950<br />
1,800<br />
1,650<br />
1,500<br />
1,350<br />
1,200<br />
1,050<br />
900<br />
750<br />
600<br />
450<br />
300<br />
150<br />
0<br />
Senior Dir./Ch<br />
Admin. air<br />
Asst.<br />
Dir.<br />
WFU Personnel Data<br />
Current and Projected<br />
Faculty<br />
Other<br />
Fac<br />
Adj.<br />
Faculty<br />
Current 55.5 116.0 142.0 432.0 85.5 39.0 490.0 278.0 168.0 21.0 259.0 2,086.0<br />
7% Growth 55.5 116.0 142.0 455.0 91.0 42.0 495.0 284.0 178.0 22.0 259.0 2,139.5<br />
12.5% Growth 55.5 116.0 142.0 473.0 95.0 44.0 500.0 288.0 185.0 23.0 258.0 2,179.5<br />
25% Grow th 55.5 116.0 142.0 514.0 105.0 48.0 509.0 298.0 203.0 25.0 259.0 2,274.5<br />
Staff<br />
Cler./T<br />
ech<br />
Grad<br />
Assts.<br />
Post<br />
Docs<br />
Pers.<br />
w /o<br />
Office<br />
Schedule of Classes: as a proxy <strong>for</strong> the class file, a database maintained by<br />
Institutional Research entitled “Duplicated Class Load Data” was used.<br />
Although containing most of the records and data found in a typical class<br />
file, manipulation of this database to eliminate duplicate records was<br />
required. Also, independent collection of data not reported <strong>for</strong> certain<br />
instructional rooms was also necessary. For the rooms that had scheduled<br />
use that were not reported and later added, course enrollments were<br />
estimated applying the station occupancy factor of 65%. This data was used<br />
to generate the current room utilization profile.<br />
Student Credit Hours: this data file was provided through Institutional<br />
Research. Although this office maintains accurate current credit hour data<br />
<strong>for</strong> the College and Calloway, not all of the data <strong>for</strong> the professional schools<br />
Totals<br />
is readily available. The file was supplemented after a detailed survey was<br />
conducted by Institutional Research.<br />
Peer Data Analysis<br />
<strong>Space</strong> data was collected from six peer institutions that were used <strong>for</strong><br />
comparative benchmarking and to analyze the reasonableness of the space<br />
needs model. The six peer institutions included: North Carolina-Chapel<br />
Hill, Notre Dame, Rice, Stan<strong>for</strong>d, Vanderbilt and William and Mary.<br />
The data show that the FTE Student to FTE faculty ratio <strong>for</strong> <strong>Wake</strong> Forest is<br />
about 10, which is on par with the peer institutions.<br />
Compared to peer universities, WFU has fairly substantial current space<br />
shortage when viewed both on a per student FTE and faculty basis. The<br />
major space categorical needs identified by the WFU space model appear to<br />
be confirmed by the peer data with several of the calculated needs per<br />
category aligning with the peers. Overall, the ASF/Faculty ratio <strong>for</strong> the six<br />
peers was 2,812, while the WFU ratio is 2,042. The ASF/FTE Student ratio<br />
<strong>for</strong> the peers is 299 while WFU‘s ratio is 213.<br />
Table 7: Peer Institution Summary Data<br />
University (a)<br />
FTE<br />
Faculty<br />
FTE<br />
Enroll<br />
Total ASF ASF per<br />
Faculty<br />
ASF per<br />
Student<br />
Student<br />
Faculty<br />
Ratio<br />
NC at Chapel Hill 3,089 25,043 5,913,829 1,915.5 236.1 8.1<br />
Notre Dame 917 11,485 3,520,096 3,836.7 306.5 12.5<br />
Rice University 618 4,855 1,567,459 2,536.7 322.9 7.9<br />
Stan<strong>for</strong>d University 1,400 14,009 6,130,915 4,379.2 437.6 10.0<br />
Vanderbilt University 592 6,329 2,268,626 3,832.1 358.4 10.7<br />
William & Mary 758 7,624 1,334,116 1,760.0 175.0 10.1<br />
Peer Average 1,229 11,558 3,455,840 2,811.9 299.0 9.4<br />
<strong>Wake</strong> Forest - Current 518 5,349 1,057,636 2,041.8 212.9 10.3<br />
(a) Main Campus only<br />
Comprehensive <strong>Facilities</strong> Planning, Inc. October 2007 9

![Guidelines for care & Use of Dry Solvent Stills [Example]](https://img.yumpu.com/4958540/1/190x245/guidelines-for-care-use-of-dry-solvent-stills-example.jpg?quality=85)