

Space Utilization Study for Academic Spaces - Facilities - Wake ...
Space Utilization Study for Academic Spaces - Facilities - Wake ...
Space Utilization Study for Academic Spaces - Facilities - Wake ...

Create successful ePaper yourself
Turn your PDF publications into a flip-book with our unique Google optimized e-Paper software.
February 18, 2008<br />
To:<br />
WFU Campus Community<br />
From: Jill Tiefenthaler, Provost<br />
Matt Cullinan, Vice President <strong>for</strong> Administration<br />
Subject: 2007 <strong>Space</strong> <strong>Utilization</strong> <strong>Study</strong><br />
After 12 months of assessment and analysis, we are pleased to provide the attached 2007<br />
<strong>Space</strong> <strong>Utilization</strong> <strong>Study</strong> summary report to the WFU community.<br />
The intent of this space study was to gather a detailed understanding of the Reynolda<br />
Campus building spaces that support our academic mission as well as understand how<br />
well those spaces were being utilized. The project involved the collection and analysis of<br />
data at a departmental level <strong>for</strong> all of the academic schools and colleges, administrative,<br />
and other support units. In total, the study assessed over 924,800 assignable square feet<br />
(ASF).<br />
It is important to note that the study did not address the quality of our academic spaces.<br />
We understand both through the strategic planning and campus master planning<br />
processes that significant renewal projects are in order <strong>for</strong> many of our facilities. The<br />
study also did not include assessments of spaces related to student life, dining,<br />
recreational sports, or athletic per<strong>for</strong>mance venues.<br />
From a campus-wide perspective, the study revealed that the campus has space shortfalls<br />
in some areas, to include office space, library space, support space and research<br />
laboratories. Conversely, the results show that the campus has sufficient classroom space<br />
and instructional lab space <strong>for</strong> our current academic curriculum. The review also found<br />
that although we do have sufficient classroom space <strong>for</strong> current academic needs, our<br />
process <strong>for</strong> efficiently scheduling and using classrooms could be improved.<br />
The report also includes analysis regarding additional space needs should there be a<br />
decision to increase undergraduate enrollment.<br />
The in<strong>for</strong>mation from this study will be invaluable in guiding the campus community in<br />
our ef<strong>for</strong>ts to finalize the Strategic Plan as well as in the development of a new campus<br />
Master Plan. We hope you find this in<strong>for</strong>mation helpful as well.<br />
Should you have any questions regarding the report or the study process, please feel free<br />
to contact Jim Alty or Mike Draughn of <strong>Facilities</strong> Management at 758-5679.
<strong>Wake</strong> Forest University<br />
<strong>Space</strong> <strong>Utilization</strong> <strong>Study</strong><br />
Summation of Findings Report<br />
October 2007<br />
Comprehensive <strong>Facilities</strong> Planning, Inc. 84 North Stanwood Road Columbus, Ohio 43209 www.cfp-planners.com
Table of Contents<br />
Table of Contents................................................................................................................................................................................... i<br />
Executive Summary...............................................................................................................................................................................1<br />
Project Scope ............................................................................................................................................................................................................................ 1<br />
<strong>Space</strong> Included in <strong>Study</strong> ........................................................................................................................................................................................................... 1<br />
Basic Data................................................................................................................................................................................................................................. 1<br />
<strong>Space</strong> Needs Calculations......................................................................................................................................................................................................... 1<br />
Peer Data Analysis.................................................................................................................................................................................................................... 3<br />
Classroom Analysis .................................................................................................................................................................................................................. 3<br />
<strong>Space</strong> Management................................................................................................................................................................................................................... 3<br />
Summary................................................................................................................................................................................................................................... 4<br />
Recommendations..................................................................................................................................................................................................................... 4<br />
Project Scope and Summation of Findings............................................................................................................................................5<br />
Tasks......................................................................................................................................................................................................................................... 5<br />
Process...................................................................................................................................................................................................................................... 5<br />
Process Methodology................................................................................................................................................................................................................ 5<br />
General Planning Assumptions................................................................................................................................................................................................. 6<br />
Basic Data................................................................................................................................................................................................................................. 8<br />
Peer Data Analysis.................................................................................................................................................................................................................... 9<br />
Current <strong>Space</strong> and Current <strong>Space</strong> Needs ................................................................................................................................................................................ 10<br />
Future <strong>Space</strong> Needs ................................................................................................................................................................................................................ 12<br />
Classroom Analysis ................................................................................................................................................................................................................ 13<br />
<strong>Space</strong> Management................................................................................................................................................................................................................. 18<br />
Conclusions ............................................................................................................................................................................................................................ 20<br />
Recommendations................................................................................................................................................................................................................... 21<br />
Appendices...........................................................................................................................................................................................22<br />
<strong>Space</strong> Needs Summaries......................................................................................................................................................................................................... 23<br />
Classroom Analysis: Detailed Data ........................................................................................................................................................................................ 29<br />
Comprehensive <strong>Facilities</strong> Planning, Inc. October 2007 i
Executive Summary<br />
Project Scope<br />
Comprehensive <strong>Facilities</strong> Planning, Inc. (CFP) was retained by <strong>Wake</strong> Forest<br />
University (WFU) to conduct a comprehensive analysis of its Reynolda<br />
campus facilities. The project involved the collection and analysis of data<br />
on a departmental level <strong>for</strong> all of the academic schools and colleges,<br />
administrative, and other support units. The tasks and process involved<br />
included the following:<br />
• Create a space inventory database.<br />
• Provide base data to in<strong>for</strong>m short and long term decision making, to<br />
be specifically used as part of a new campus master plan.<br />
• Collect peer data and evaluate the University’s current space and<br />
needs to comparable universities.<br />
• Prepare space needs calculations.<br />
• Model future space needs based on three projected across-the board<br />
undergraduate enrollment scenarios.<br />
• Recommend policies, procedures and guidelines <strong>for</strong> improving the<br />
University’s space management practices.<br />
<strong>Space</strong> Included in <strong>Study</strong><br />
The space utilization study was limited to the Reynolda campus of <strong>Wake</strong><br />
Forest University located in Winston-Salem, North Carolina. Residential,<br />
food service, athletic per<strong>for</strong>mance venues, and building support facilities<br />
(i.e., mechanical rooms, etc.) were not included in the scope of the study.<br />
All academic and administrative units were included in this study. Current<br />
space included in this report totals just over 924,800 assignable square feet<br />
(ASF).<br />
Basic Data<br />
The space needs modeling methodology is a data-driven process that<br />
utilizes four data files. These four databases are the current campus space<br />
inventory, current personnel, Fall 2006 class schedule and Fall 2006 student<br />
credit hours. These files were compiled into an aggregate relational<br />
database and appropriately mapped or linked to generate the <strong>for</strong>mula-based<br />
space needs calculations.<br />
<strong>Space</strong> Needs Calculations<br />
The current calculated needs shown in Table 1 indicate the University<br />
should have about 1,010,100 square feet of space. The current calculated<br />
need identifies a net deficit of just over 9% of the current space (85,300<br />
ASF). Most of this current need is in administrative and support units. The<br />
aggregate assigned space of the academic colleges matches up well with the<br />
calculated need.<br />
Table 1: Current <strong>Space</strong> Needs<br />
Division Current ASF Current Need Difference<br />
President 2,480 2,239 241<br />
VP Investments 1,739 2,210 -471<br />
VP Student Life 61,169 56,881 4,288<br />
VP General Counsel 1,619 1,719 -16,370<br />
VP Advancement 17,989 20,796 -2,807<br />
VP Administration 51,630 55,768 -4,138<br />
Sr. VP Finance 26,238 30,259 -4,021<br />
Provost 680,565 724,703 -44,138<br />
Athletics 43,609 43,340 269<br />
Campuswide Support 37,770 72,194 -34,424<br />
Total 924,808 1,010,109 -85,301<br />
<strong>Space</strong> needs <strong>for</strong> three potential undergraduate enrollment growth scenarios<br />
were also developed. These scenarios uni<strong>for</strong>mly increase the undergraduate<br />
enrollments <strong>for</strong> the College and Calloway School of Business and<br />
Accountancy by the following increments: 7%, 12.5% and 25%. Based on<br />
Comprehensive <strong>Facilities</strong> Planning, Inc. October 2007 1
<strong>Wake</strong> Forest <strong>Space</strong> <strong>Utilization</strong> <strong>Study</strong><br />
Executive Summary<br />
these increments, an estimation of relative growth in staffing needs was<br />
developed and factored into the calculations. This process produced<br />
projected increases in staffing ranging from 2.5% to 9%, with the 25%<br />
growth scenario identifying a potential total increase of over 188 positions.<br />
As displayed in Table 2, the growth scenarios produce aggregate space<br />
needs of 1.041 million, 1.059 million and 1.1 million square feet or<br />
additional space deficits of 12.5% (115,787 ASF); to 14.5% (134,300 ASF);<br />
to 19% (175,831 ASF) respectively.<br />
Table 2: Projected <strong>Space</strong> Needs<br />
Division<br />
Current<br />
ASF<br />
7% UG<br />
Growth<br />
Scenario<br />
12.5% UG<br />
Growth<br />
Scenario<br />
25% UG<br />
Growth<br />
Scenario<br />
President 2,480 2,239 2,239 2,239<br />
VP Investments 1,739 2,210 2,210 2,210<br />
VP Student Life 61,169 57,324 57,575 58,144<br />
VP General Counsel 1,619 1,719 1,719 1,719<br />
VP Advancement 17,989 20,796 20,796 20,796<br />
VP Administration 51,630 55,768 55,768 55,768<br />
Sr. VP Finance 26,238 30,259 30,259 30,259<br />
Provost 680,565 752,694 769,603 807,568<br />
Athletics 43,609 43,340 43,340 43,340<br />
Campuswide Support 37,770 74,246 75,617 78,596<br />
Total 924,808 1,040,595 1,059,126 1,100,639<br />
Table 3 displays the current and project needs by type of space. The<br />
campus has sufficient instructional space (classrooms and teaching labs) to<br />
meet both its current as well as projected needs. The greatest aggregate<br />
need in all four scenarios is in library space, with a current need of about<br />
49,800 ASF. Campus support space (i.e., shops, storage, etc.) is the next<br />
greatest space type need followed by offices <strong>for</strong> the current and 7%<br />
scenarios. This order of need is reversed in the latter two scenarios with<br />
offices needs exceeding support space. Current research space is deficient<br />
by about 16%, which increases to almost 38% if the enrollment grows by<br />
25%. General use space, especially in student lounges, is the next major<br />
category where a modest deficit was identified in each scenario.<br />
Table 3: Current and Projected <strong>Space</strong> Needs by space Type<br />
<strong>Space</strong> Type<br />
Current<br />
ASF<br />
Current<br />
Need<br />
7% UG<br />
Growth<br />
12.5% UG<br />
Growth<br />
25% UG<br />
Growth<br />
Classrooms 115,015 82,808 86,967 90,235 97,657<br />
Instruct. Labs 62,564 55,477 58,616 61,081 66,685<br />
Research Labs 60,711 70,356 73,851 76,916 83,661<br />
Offices 343,354 368,853 377,804 384,836 400,820<br />
Library 159,455 209,254 217,094 217,827 219,494<br />
Special Use 23,930 24,272 24,288 24,300 24,327<br />
Student Lounge 13,022 15,302 15,831 16,248 17,194<br />
Oth. General Use 106,567 108,740 108,851 108,851 108,851<br />
Support 36,050 70,372 72,493 73,920 76,800<br />
Health Ctr. 4,140 4,675 4,800 4,912 5,150<br />
Total 924,808 1,010,109 1,040,595 1,059,126 1,100,639<br />
Table 4 displays the current and project needs by academic college. Current<br />
needs indicate in general the current space is adequate to meet the current<br />
needs. Future space needs <strong>for</strong> the departments in the College and the<br />
Calloway School are impacted by the planned enrollment growth.<br />
Assuming existing instructional space (classrooms and instructional labs) is<br />
retained to address future growth and will not be reprogrammed to meet<br />
other needs, the “real” future space deficit <strong>for</strong> the College ranges from<br />
about 41,900 ASF to 78,100 ASF. For Calloway the “real” need ranges<br />
from a deficit of 3,050 ASF to approximately 4,900 ASF.<br />
Comprehensive <strong>Facilities</strong> Planning, Inc. October 2007 2
<strong>Wake</strong> Forest <strong>Space</strong> <strong>Utilization</strong> <strong>Study</strong><br />
Executive Summary<br />
Table 4: Current and Project space Needs by College<br />
College<br />
Current<br />
ASF<br />
Current<br />
Need<br />
7% UG<br />
Growth<br />
12.5% UG<br />
Growth<br />
25% UG<br />
Growth<br />
Divinity School 16,813 14,013 14,013 14,013 14,013<br />
School of Law 82,799 85,083 85,083 85,083 85,083<br />
Babcock 32,739 30,403 30,403 30,403 30,403<br />
Grad School 2,376 2,773 2,773 2,773 2,773<br />
Calloway 27,191 23,733 24,954 25,841 27,859<br />
The College 384,468 386,386 404,946 419,831 453,436<br />
Totals 546,386 542,391 562,172 577,944 613,567<br />
Detailed space needs calculations reports were developed <strong>for</strong> each<br />
department and are available <strong>for</strong> review through <strong>Facilities</strong> Management.<br />
Peer Data Analysis<br />
<strong>Space</strong> data collected from six peer institutions were used <strong>for</strong> comparative<br />
benchmarking and to analyze the reasonableness of the space needs<br />
calculations.<br />
The data show that the FTE student to FTE faculty ratio <strong>for</strong> <strong>Wake</strong> Forest is<br />
about 10:1 which are on par with the peer institutions.<br />
Compared to peer universities, WFU has a fairly substantial current space<br />
shortage when viewed both on a per student FTE and faculty basis.<br />
Additional details regarding the peer analysis are presented in later sections<br />
of this report.<br />
Classroom Analysis<br />
A focused analysis of classroom needs was completed as part of the study,<br />
using the Fall 2006 semester demand as a baseline.<br />
The current classroom supply consists of 159 rooms scheduled by the<br />
academic departments. These rooms are composed of 116 classrooms, 31<br />
seminar rooms and 12 lecture halls.<br />
exception of the Divinity School, this utilization pattern was relatively<br />
consistent among all of the colleges.<br />
For planning purposes the University’s room usage goal <strong>for</strong> scheduled use<br />
is 25 hours per week along with an increase of the station occupancy ratio<br />
to 65%.<br />
Applying these goals, the analysis shows that each college has adequate<br />
classroom space to meet their current needs.<br />
The primary focus of the analysis was on the capacity of the existing<br />
classroom supply to accommodate the proposed enrollment growth<br />
scenarios. The needs of the College and the Calloway School were<br />
specifically evaluated and identified. The 25% enrollment growth scenario<br />
was used to determine an upper range of need. For the College the analysis<br />
determined the existing classroom supply has sufficient capacity to<br />
accommodate a 25% undergraduate enrollment increase. A review of room<br />
capacity sizes indicated a deficit of rooms with less than 30 seats.<br />
However, surplus rooms in larger room sizes are available to offset these<br />
needs.<br />
The Calloway School has sufficient capacity to meet its future needs if the<br />
current station occupancy rate of 71% is maintained. Applying the station<br />
occupancy goal of 65% indicates a need of two additional rooms in the 50<br />
to 70 seat size range.<br />
<strong>Space</strong> Management<br />
Part of this study also included the development of recommendations and<br />
documents <strong>for</strong> establishing a more <strong>for</strong>mal space management process.<br />
Besides the creation of a space inventory database to assist with the tracking<br />
of the University’s space resources, a range of policies and procedures as<br />
well as space planning guidelines were developed to provide a<br />
recommended structure <strong>for</strong> ongoing space management that may be<br />
implemented over time. Separate documents were prepared <strong>for</strong> this part of<br />
the study and are available from <strong>Facilities</strong> Management <strong>for</strong> review.<br />
Campus-wide the classrooms were used about 20 hours per week on<br />
average (8 am to 5 pm) with 63% of the seats filled when in use. With the<br />
Comprehensive <strong>Facilities</strong> Planning, Inc. October 2007 3
<strong>Wake</strong> Forest <strong>Space</strong> <strong>Utilization</strong> <strong>Study</strong><br />
Executive Summary<br />
Summary<br />
The University’s current calculated space need is about 1.010 million ASF,<br />
or a net space deficiency of about 9% concentrated in three primary<br />
categories: library, campus support and offices. In general, the academic<br />
colleges aggregate space needs are being met by the existing supply. The<br />
School of Law and the College have modest current space needs with the<br />
other units needs adequately addressed. As the projected enrollment growth<br />
scenarios are factored in however, there will be areas of significant need<br />
specifically in the College. Future aggregate campus space needs based on<br />
the planned enrollment growth scenarios indicate total needs of 1.040<br />
million ASF (a 12.5% deficit); to 1.059 million ASF (a 14.5% deficit; to 1.1<br />
million ASF (a 19% deficit).<br />
With the planned enrollment growth, the future space needs <strong>for</strong> the College<br />
could approach 78,100 ASF or about 20%. additional. Classroom space is<br />
adequate to address both current and future needs with improvements to<br />
existing scheduling and utilization practices.<br />
In general, quality of space does not seem to be a significant issue on the<br />
Reynolda campus. Although there are several older buildings such as<br />
Tribble Hall that will require upgrading, there were no critical quality issues<br />
noted.<br />
2) Should the University periodically update these space needs,<br />
modifications to the type of data and <strong>for</strong>mats used in the process should be<br />
reviewed and implemented. The current study required significant<br />
supplementation and manipulation of some of the data to generate the<br />
model. Updating the space needs will require similar ef<strong>for</strong>ts unless<br />
improved database coordination and <strong>for</strong>matting is achieved. Improvements<br />
to the basic data inputs include:<br />
• Developing a class file that requires the reporting of all scheduled<br />
instructional activity in University-owned space.<br />
• A consolidation of reporting from all colleges by course of all student<br />
credit hours by term and course designation.<br />
• Creating a comprehensive personnel database that includes not only all<br />
full time employees, but also open positions, non-university, student<br />
employees and graduate assistants.<br />
3) The University should consider investing in database management<br />
software systems <strong>for</strong> maintaining their space inventory and other facilities<br />
data, as well as scheduling software <strong>for</strong> classrooms and other facilities.<br />
Recommendations<br />
1) The University should consider implementing a <strong>for</strong>mal space<br />
management process that includes:<br />
• Periodic updating of its space inventory database through both selfreporting<br />
by departments and field audits.<br />
• Implementing a space allocation procedure to address needs that cannot<br />
be met within the management of a particular college.<br />
• Periodically updating its space needs calculations as input into future<br />
capital planning.<br />
Consideration should also be given <strong>for</strong> establishing a space planning office<br />
responsible <strong>for</strong> the coordination of these ef<strong>for</strong>ts.<br />
Comprehensive <strong>Facilities</strong> Planning, Inc. October 2007 4
<strong>Wake</strong> Forest <strong>Space</strong> <strong>Utilization</strong> <strong>Study</strong><br />
Project Scope and Summation of Findings<br />
Project Scope and Summation of<br />
Findings<br />
Comprehensive <strong>Facilities</strong> Planning, Inc. (CFP) was retained by <strong>Wake</strong> Forest<br />
University (WFU) to conduct a comprehensive study and analysis of its<br />
campus facilities. This project involved the collection and analysis of data<br />
on a departmental level <strong>for</strong> all of the academic schools and colleges, as well<br />
as most of the administrative, athletic and support units on the Reynolda<br />
campus only. Residential, food service, athletic competition space and<br />
building support space were excluded from the scope of work.<br />
Tasks<br />
• Create a space inventory database using currently accepted national<br />
classification and coding conventions.<br />
• Provide base data to in<strong>for</strong>m short and long term decision making<br />
concerning the reprogramming and/or construction of new space, the<br />
renovation and the appropriate utilization of existing space,<br />
specifically to be used as part of a new campus master plan.<br />
• Provide the tools necessary to develop a comprehensive planning<br />
approach to assist the University in setting capital project priorities.<br />
• Collect peer data and evaluate the University’s current space and<br />
space need to comparable universities.<br />
• Prepare space needs calculations based on current demands and<br />
compare with available facilities.<br />
• Model future space needs based on three projected enrollment<br />
scenarios. These scenarios included across-the board increases <strong>for</strong><br />
undergraduate enrollments <strong>for</strong> the College and the Calloway School<br />
of Business and Accountancy. The three projected enrollment levels<br />
are: 7%, 12.5% and 25%.<br />
• Document and develop a recommended set of policies, procedures<br />
and guidelines <strong>for</strong> improving the campus’ space management<br />
practices.<br />
Process<br />
The following steps are involved in the space utilization analysis:<br />
• Review and confirm existing space utilization.<br />
• Develop appropriate space guidelines <strong>for</strong> each academic department<br />
and administrative units. Compare guidelines to collected peer data.<br />
• Evaluate existing facilities to determine space deficiencies and<br />
surpluses.<br />
• Provide the process tools and methodology <strong>for</strong> the ongoing<br />
prioritization of major capital and renovation investment projects.<br />
This study is a critical step in developing a space management process that<br />
clearly identifies the current space requirements (departmental space<br />
deficiencies or surpluses) and establishing capital planning priorities.<br />
General planning assumptions applied in the analysis are presented in the<br />
following section. Summaries of the calculated space needs are presented<br />
in the following sections of this report. Detailed space needs reports <strong>for</strong><br />
each department have been produced as a separate document and are<br />
available through <strong>Facilities</strong> Management.<br />
Process Methodology<br />
The methodology used included measuring the quantitative space needs that<br />
may impact the delivery of services. This quantitative process calculates<br />
space needs based on a series of interactive work steps. Data and<br />
programmatic in<strong>for</strong>mation from various user groups were gathered,<br />
analyzed, and documented. The data and assumptions developed from<br />
these initial steps were verified and adjusted to customize the space needs<br />
model <strong>for</strong> each department, including space criteria (modules) <strong>for</strong> the type<br />
of space being analyzed.<br />
The space need requirements, including the square footage amounts of each<br />
room type were determined by the discipline, equipment used in the area,<br />
utilization rates (i.e., station area, station occupancy ratios, and room<br />
utilization rates), number of persons occupying the space, etc. The results<br />
derived from the space needs calculations were then compared to the<br />
current assigned space to determine surpluses or deficiencies of space.<br />
Comprehensive <strong>Facilities</strong> Planning, Inc. October 2007 5
<strong>Wake</strong> Forest <strong>Space</strong> <strong>Utilization</strong> <strong>Study</strong><br />
Project Scope and Summation of Findings<br />
General Planning Assumptions<br />
The following general planning assumptions were developed from direction<br />
provided by WFU. These planning assumptions provide guiding principles,<br />
which are critical in the <strong>for</strong>mulation of the results of this study.<br />
1. The basic data used in this study were provided by <strong>Facilities</strong><br />
Management (space inventory), Human Resources (personnel), class<br />
schedule and credit hour data (Institutional Research). Fall 2006 was<br />
used as the baseline <strong>for</strong> this study.<br />
2. This study is limited to space assigned to the administrative and<br />
academic units located on the Reynolda Campus. Building support<br />
facilities (i.e., mechanical rooms, corridors, etc.) residence halls, food<br />
services, athletic competition facilities, and non-university operations<br />
are not part of the scope of this study.<br />
3. The primary focus of this analysis is on the quantity of space by type<br />
and its use. Although only noted as it may impact the space needs,<br />
physical condition and functional quality issues have not been assessed<br />
as part of the analysis.<br />
4. The space needs calculations are based on nationally recognized space<br />
planning guidelines such as the Council of Educational Facility<br />
Planners (CEFPI) <strong>Space</strong> Planning Guidelines and the applied<br />
experience of the CFP consultants. These guidelines have been<br />
modified as needed to fit the culture and operations of the University<br />
and each department.<br />
5. Full time faculty, instructors and visiting faculty have each been<br />
provided with a uni<strong>for</strong>m office module size of 150 square feet (ASF).<br />
Adjunct faculty have been allocated an office module of 35 ASF; post<br />
doctoral student 120 ASF and graduate assistants 90 ASF. No office<br />
space has been allocated <strong>for</strong> emeriti faculty. Office modules sizes <strong>for</strong><br />
these and other positions are further elaborated in the University’s<br />
<strong>Space</strong> Planning Guidelines available through <strong>Facilities</strong> Management.<br />
6. Laboratory-based research space needs are based on the number of<br />
personnel engaged in research including: faculty, research scientists,<br />
research staff, graduate research assistants, and post-doctoral students.<br />
For planning purposes it is assumed that 100% of the faculty, graduate<br />
research assistants and post-doctoral students in lab-based research<br />
departments are engaged in research activities. When identified as part<br />
of a department’s curriculum requirements, undergraduate researchers<br />
have been included in the calculation <strong>for</strong> research laboratory space.<br />
When provided in the model, the undergraduate research space<br />
allocation is one-third of the typical space module <strong>for</strong> the particular<br />
discipline.<br />
7. Certain laboratory space has been classified as “special use” labs that<br />
may not be assigned to a specific faculty or researcher and likely are<br />
shared spaces that are functionally unique usually because of<br />
specialized equipment. Unless noted these existing spaces have been<br />
assumed to be sufficient.<br />
8. The space needs calculations <strong>for</strong> all departments include an allocation<br />
<strong>for</strong> conference room and office lounge space. Although these<br />
calculated needs may not generate sufficient space <strong>for</strong> a functional<br />
room, the generated need is recognized as a space allocation, and it is<br />
assumed that in practice shared conference space or lounges would be<br />
provided to serve two or more departments in order to create a<br />
functional room.<br />
9. Typically a factor of 10% of the calculated office need has been applied<br />
to determine office service space <strong>for</strong> academic departments and 15%<br />
<strong>for</strong> most administrative departments unless otherwise noted.<br />
Supplemental office support space requirements have been recognized<br />
above the normal office service allocation <strong>for</strong> departments requiring<br />
waiting rooms, processing areas and longer-term storage needs.<br />
Typically these departments include operations dealing with the public<br />
and students such as senior administrative and student service offices.<br />
10. For space planning purposes full time equivalent student counts have<br />
been determined using a conversion factor of 15 credit hours per<br />
undergraduate student and 12 credit hours per graduate student. These<br />
FTE totals are used in calculating certain space needs such as<br />
classrooms and student lounges.<br />
11. Classroom space needs have been analyzed by applying a uni<strong>for</strong>m set<br />
of utilization goals across all departments within each college. The<br />
following utilization goals have been used in developing the classroom<br />
space needs: 25 Weekly Room Hours <strong>for</strong> scheduled use; 65% station<br />
occupancy in scheduled rooms and 20 assignable square feet per<br />
student station. These factors are modeling averages that may vary as<br />
related to existing usage patterns and conditions. For analysis<br />
purposes, the hours available <strong>for</strong> scheduling instruction and<br />
Comprehensive <strong>Facilities</strong> Planning, Inc. October 2007 6
<strong>Wake</strong> Forest <strong>Space</strong> <strong>Utilization</strong> <strong>Study</strong><br />
Project Scope and Summation of Findings<br />
determining utilization have been reduced to recognize the Tuesday and<br />
Thursday chapel times and no Friday evening classes. Furthermore, it<br />
is assumed that the University will maintain its current department<br />
level scheduling practices.<br />
12. Instructional laboratory needs have been identified by individual<br />
academic program within each department. Lab calculation criteria<br />
have been modified to reflect current instructional requirements per<br />
program area. Programs that do not generate sufficient student credit<br />
hours to calculate a functional lab facility are provided with a minimum<br />
lab need as it is assumed delivery of the instructional program requires<br />
the provision of a functional lab space.<br />
13. Three “across-the-board” undergraduate enrollment growth scenario<br />
increments have been used. Future space needs scenarios are based on<br />
incremental increases of 7%, 12.5% and 25%. Professional school<br />
enrollments are assumed to remain stable <strong>for</strong> this planning period.<br />
14. Faculty and staffing personnel projections included in the study are<br />
based upon the projected enrollments. Projected personnel counts were<br />
reviewed by the Provost, Deans and other senior administrators.<br />
Projected staffing <strong>for</strong> all academic departments generating student<br />
credit hours are assumed to increase proportionately to projected<br />
enrollments <strong>for</strong> the respective department. Staffing <strong>for</strong> certain nonacademic<br />
departments that are student service oriented and are sensitive<br />
to overall campus enrollment growth have been projected using a<br />
campus-wide enrollment growth factor. Staffing needs <strong>for</strong> other<br />
departments have been reviewed on a case-by-case basis. These<br />
projections are assumed to be realistic expectations <strong>for</strong> future staffing<br />
levels.<br />
15. A space allocation <strong>for</strong> student lounge space is provided <strong>for</strong> each<br />
academic department. .<br />
16. Current space allocations <strong>for</strong> certain types of space needs are assumed<br />
to be sufficient and must be reviewed on a case by case basis.<br />
Typically these types of space will include: departmental libraries;<br />
student lounges assigned to administrative units; training rooms; testing<br />
rooms and interview rooms.<br />
Enrollment Increase Assumptions<br />
The Fall semester term 2006 served as the base year <strong>for</strong> student<br />
enrollments:<br />
Fall 2006 Baseline Enrollment – Reynolda Campus<br />
Table 5: Fall 2006 Student Data<br />
Headcount Credit Hours FTE<br />
Undergraduate 3,972* 60,742 3,932*<br />
Graduate 1,543 16,764 1,507<br />
Totals 5,515 77,506 5,439<br />
* Does not include study abroad students.<br />
Enrollment increase assumptions <strong>for</strong> the five year period from the base term<br />
of Fall 2006 were determined based on the following:<br />
The planning scenarios <strong>for</strong> the space needs calculations include three<br />
uni<strong>for</strong>m incremental growth categories. The projected space needs<br />
there<strong>for</strong>e have been developed using across-the-board growth rates of 7%,<br />
12.5%, and 25% applied to the current student credit hour distribution.<br />
Enrollments <strong>for</strong> graduate and professional programs are assumed will<br />
remain stable.<br />
These incremental enrollment increases are expected to occur in the two<br />
undergraduate colleges presented in Table 6:<br />
Comprehensive <strong>Facilities</strong> Planning, Inc. October 2007 7
<strong>Wake</strong> Forest <strong>Space</strong> <strong>Utilization</strong> <strong>Study</strong><br />
Project Scope and Summation of Findings<br />
Table 6: Current and Project Student Data – The College and Calloway<br />
Dean of the College<br />
College FTE Credit Hours<br />
Current 3,696 54,710<br />
7% Growth Scenario 3,937 58,337<br />
12.5% Growth Scenario 4,127 61,187<br />
25% Growth Scenario 4,559 67,665<br />
Calloway School of Business<br />
Current 413 5,964<br />
7% Growth Scenario 436 6,318<br />
12.5% Growth Scenario 454 6,597<br />
25% Growth Scenario 497 7,230<br />
Assumptions:<br />
• The teaching ratios will remain constant <strong>for</strong> most units over this period;<br />
hence the number of faculty will increase in proportion to the percent<br />
FTE change in the table above.<br />
• The change in teaching lab credit hour instruction is proportional to the<br />
percent FTE change.<br />
• Staffing and space <strong>for</strong> the non academic units that are not sensitive to<br />
enrollment changes will remain at their current level.<br />
Basic Data<br />
The space needs modeling methodology used in this assessment is a datadriven<br />
process that utilizes four data files that are maintained by the<br />
University. These four databases are the space inventory, personnel,<br />
schedule of classes (class file) and student credit hours. These files were<br />
compiled into an aggregate relational database and appropriately mapped or<br />
linked to generate the <strong>for</strong>mula-based space needs calculations. A brief<br />
overview of the process used in collecting, verifying and modifying these<br />
files follows:<br />
<strong>Space</strong> Inventory: the space inventory was created from the existing<br />
Autocad drawings maintained by <strong>Facilities</strong> Management. Key data<br />
elements acquired from the drawings included building and room locations,<br />
square feet, room use or type and departmental assignment. National room<br />
use coding conventions were used <strong>for</strong> classifying the space and existing<br />
budget codes were used to identify the departmental assignments. Each<br />
department was then requested to review this data to insure the data was<br />
correct.<br />
Personnel Data: a basic personnel database was provided through the<br />
University’s Human Resources department. This data was supplemented<br />
with other positions not typically reported to Human Resources including<br />
authorized, open positions; non-university personnel; student employees;<br />
and graduate assistants. Each department reviewed and verified the data <strong>for</strong><br />
accuracy. The verified data was then mapped to relate to the appropriate<br />
space department. Based on position title each position was also<br />
categorized to relate to an appropriate office module size. Although most<br />
position titles and responsibilities are uni<strong>for</strong>m across the University, there<br />
are some that are not similar although they carry the same title. These<br />
positions required manipulation within the database to correctly map the<br />
position type with the appropriate office module type.<br />
Projected personnel were generated using an enrollment based process<br />
depending on whether a particular department’s staffing may be sensitive to<br />
enrollment changes. There<strong>for</strong>e, based on the projected enrollments a<br />
department’s staffing was increased proportionately. This process may<br />
have resulted in calculated personnel that included fractional numbers.<br />
Chart 1 presents the current and projected personnel counts used in the<br />
analysis:<br />
Comprehensive <strong>Facilities</strong> Planning, Inc. October 2007 8
<strong>Wake</strong> Forest <strong>Space</strong> <strong>Utilization</strong> <strong>Study</strong><br />
Project Scope and Summation of Findings<br />
Chart 1: Current and Projected Personnel<br />
2,400<br />
2,250<br />
2,100<br />
1,950<br />
1,800<br />
1,650<br />
1,500<br />
1,350<br />
1,200<br />
1,050<br />
900<br />
750<br />
600<br />
450<br />
300<br />
150<br />
0<br />
Senior Dir./Ch<br />
Admin. air<br />
Asst.<br />
Dir.<br />
WFU Personnel Data<br />
Current and Projected<br />
Faculty<br />
Other<br />
Fac<br />
Adj.<br />
Faculty<br />
Current 55.5 116.0 142.0 432.0 85.5 39.0 490.0 278.0 168.0 21.0 259.0 2,086.0<br />
7% Growth 55.5 116.0 142.0 455.0 91.0 42.0 495.0 284.0 178.0 22.0 259.0 2,139.5<br />
12.5% Growth 55.5 116.0 142.0 473.0 95.0 44.0 500.0 288.0 185.0 23.0 258.0 2,179.5<br />
25% Grow th 55.5 116.0 142.0 514.0 105.0 48.0 509.0 298.0 203.0 25.0 259.0 2,274.5<br />
Staff<br />
Cler./T<br />
ech<br />
Grad<br />
Assts.<br />
Post<br />
Docs<br />
Pers.<br />
w /o<br />
Office<br />
Schedule of Classes: as a proxy <strong>for</strong> the class file, a database maintained by<br />
Institutional Research entitled “Duplicated Class Load Data” was used.<br />
Although containing most of the records and data found in a typical class<br />
file, manipulation of this database to eliminate duplicate records was<br />
required. Also, independent collection of data not reported <strong>for</strong> certain<br />
instructional rooms was also necessary. For the rooms that had scheduled<br />
use that were not reported and later added, course enrollments were<br />
estimated applying the station occupancy factor of 65%. This data was used<br />
to generate the current room utilization profile.<br />
Student Credit Hours: this data file was provided through Institutional<br />
Research. Although this office maintains accurate current credit hour data<br />
<strong>for</strong> the College and Calloway, not all of the data <strong>for</strong> the professional schools<br />
Totals<br />
is readily available. The file was supplemented after a detailed survey was<br />
conducted by Institutional Research.<br />
Peer Data Analysis<br />
<strong>Space</strong> data was collected from six peer institutions that were used <strong>for</strong><br />
comparative benchmarking and to analyze the reasonableness of the space<br />
needs model. The six peer institutions included: North Carolina-Chapel<br />
Hill, Notre Dame, Rice, Stan<strong>for</strong>d, Vanderbilt and William and Mary.<br />
The data show that the FTE Student to FTE faculty ratio <strong>for</strong> <strong>Wake</strong> Forest is<br />
about 10, which is on par with the peer institutions.<br />
Compared to peer universities, WFU has fairly substantial current space<br />
shortage when viewed both on a per student FTE and faculty basis. The<br />
major space categorical needs identified by the WFU space model appear to<br />
be confirmed by the peer data with several of the calculated needs per<br />
category aligning with the peers. Overall, the ASF/Faculty ratio <strong>for</strong> the six<br />
peers was 2,812, while the WFU ratio is 2,042. The ASF/FTE Student ratio<br />
<strong>for</strong> the peers is 299 while WFU‘s ratio is 213.<br />
Table 7: Peer Institution Summary Data<br />
University (a)<br />
FTE<br />
Faculty<br />
FTE<br />
Enroll<br />
Total ASF ASF per<br />
Faculty<br />
ASF per<br />
Student<br />
Student<br />
Faculty<br />
Ratio<br />
NC at Chapel Hill 3,089 25,043 5,913,829 1,915.5 236.1 8.1<br />
Notre Dame 917 11,485 3,520,096 3,836.7 306.5 12.5<br />
Rice University 618 4,855 1,567,459 2,536.7 322.9 7.9<br />
Stan<strong>for</strong>d University 1,400 14,009 6,130,915 4,379.2 437.6 10.0<br />
Vanderbilt University 592 6,329 2,268,626 3,832.1 358.4 10.7<br />
William & Mary 758 7,624 1,334,116 1,760.0 175.0 10.1<br />
Peer Average 1,229 11,558 3,455,840 2,811.9 299.0 9.4<br />
<strong>Wake</strong> Forest - Current 518 5,349 1,057,636 2,041.8 212.9 10.3<br />
(a) Main Campus only<br />
Comprehensive <strong>Facilities</strong> Planning, Inc. October 2007 9
<strong>Wake</strong> Forest <strong>Space</strong> <strong>Utilization</strong> <strong>Study</strong><br />
Project Scope and Summation of Findings<br />
Current <strong>Space</strong> and Current <strong>Space</strong> Needs<br />
The space inventory data maintained by <strong>Facilities</strong> Management was used as<br />
the basis <strong>for</strong> identifying the current space assignment profiles <strong>for</strong> each<br />
department. The scope of this assessment includes 924,808 square feet<br />
(excluding residential facilities, non assignable, athletic per<strong>for</strong>mance<br />
venues, non-university operations and unassigned areas). Table 8 displays<br />
the assignable space by room use type <strong>for</strong> the areas analyzed in the scope of<br />
this study<br />
Table 8: <strong>Space</strong> Included in Project Scope<br />
<strong>Space</strong> Type Current ASF Percent<br />
Classrooms 115,015 12.4%<br />
Instruct. Labs 62,564 6.8%<br />
Research Labs 60,711 6.6%<br />
Offices 343,354 37.1%<br />
Library 159,455 17.2%<br />
Special Use 23,930 2.6%<br />
Stud. Lounge 13,022 1.4%<br />
Oth. General Use 106,567 11.5%<br />
Support 36,050 3.9%<br />
Health Ctr. 4,140 0.4%<br />
Total 924,808 100.0%<br />
Summary findings of the current space needs <strong>for</strong> the Reynolda campus are<br />
as follows:<br />
Summary Findings: Total Campus by Division<br />
The total campus space needs by division are summarized in Table 9:<br />
Table 9: Total Current <strong>Space</strong> Needs by Division<br />
Division Current ASF Current Need Difference<br />
President 2,480 2,239 241<br />
VP Investments 1,739 2,210 -471<br />
VP Student Life 61,169 56,881 4,288<br />
VP General Counsel 1,619 1,719 -100<br />
VP Advancement 17,989 20,796 -2,807<br />
VP Administration 51,630 55,768 -4,138<br />
Sr. VP Finance 26,238 30,259 -4,021<br />
Provost 680,565 724,703 -44,138<br />
Athletics 43,609 43,340 269<br />
Campuswide Support 37,770 72,194 -34,424<br />
Total 924,808 1,010,109 -85,301<br />
• The current calculated space needs <strong>for</strong> the total campus indicates a net<br />
deficit of 9.2% or about 85,300 ASF.<br />
• The current deficit is entirely in administrative support operations. The<br />
aggregate calculated needs <strong>for</strong> the academic colleges are on par with<br />
the current inventory.<br />
• Library space is the largest component of the current deficit (58%).<br />
Campus support space (i.e., central storage, shops, vehicle storage, etc.)<br />
makes up the next largest component of the current deficit (40%).<br />
• Of the nine major campus divisions, three were determined to have<br />
current needs. These include Administration, Finance and<br />
Advancement. Current space <strong>for</strong> the other divisions is sufficient.<br />
See Chart SN1 in the Appendix <strong>for</strong> a more detailed summary of the total<br />
campus current space needs.<br />
Comprehensive <strong>Facilities</strong> Planning, Inc. October 2007 10
<strong>Wake</strong> Forest <strong>Space</strong> <strong>Utilization</strong> <strong>Study</strong><br />
Project Scope and Summation of Findings<br />
Summary Findings: By <strong>Space</strong> Type<br />
Current space needs by room use type are summarized in Table 10:<br />
Table 10: Current <strong>Space</strong> Needs by <strong>Space</strong> Type<br />
<strong>Space</strong> Type Current ASF Current Need Difference<br />
Classrooms 115,015 82,808 32,207<br />
Instruct. Labs 62,564 55,477 7,087<br />
Research Labs 60,711 70,356 -9,645<br />
Offices 343,354 368,853 -25,499<br />
Library 159,455 209,254 -49,799<br />
Special Use 23,930 24,272 -342<br />
Stud. Lounge 13,022 15,302 -2,280<br />
Oth. General Use 106,567 108,740 -2,173<br />
Support 36,050 70,372 -34,322<br />
Health Ctr. 4,140 4,675 -535<br />
Total 924,808 1,010,109 -85,301<br />
• Classroom and instructional laboratory space is sufficient to meet<br />
current needs and has excess capacity to meet potential future growth.<br />
• Assuming the existing instructional space is retained to address future<br />
growth and is not reprogrammed to other uses, the current “real” space<br />
deficit is approximately 124,600 ASF.<br />
• Research laboratory space is deficient by 9,645 ASF or about 7.7% of<br />
the current need.<br />
See Chart SN5 in the Appendix <strong>for</strong> more details of the space needs by type.<br />
Summary Findings: By College<br />
Current space needs by college are summarized in Table 11:<br />
Table 11: Current <strong>Space</strong> Needs by College<br />
College Current ASF Current Need Difference<br />
Divinity School 16,813 14,013 2,800<br />
School of Law 82,799 85,083 -2,284<br />
Babcock 32,739 30,403 2,336<br />
Grad School 2,376 2,773 -397<br />
Calloway 27,191 23,733 3,458<br />
The College 384,468 386,386 -1,918<br />
Totals 546,386 542,391 3,995<br />
• The calculated space needs <strong>for</strong> the three of the five academic colleges<br />
indicate the existing space is sufficient. The College and Law have<br />
modest needs. The College has a need of approximately 1,900 ASF,<br />
and Law about 2,300 ASF.<br />
See Chart SN5 in the Appendix <strong>for</strong> more details of the space needs by<br />
college.<br />
Departments with Greatest Current Needs<br />
The following departments were identified as having the greatest current net<br />
space need (deficit):<br />
• Office space is currently about 20% deficient or about 25,500 ASF.<br />
• Library space is the largest component of the space type deficit or 40%<br />
of the “real” need.<br />
• Campus support space constitutes about 28% of the need.<br />
• Other campus support space including student lounges, other general<br />
use space and health center space is just over 4% of the deficit.<br />
Comprehensive <strong>Facilities</strong> Planning, Inc. October 2007 11
<strong>Wake</strong> Forest <strong>Space</strong> <strong>Utilization</strong> <strong>Study</strong><br />
Project Scope and Summation of Findings<br />
Table 12: Departments with Greatest Current <strong>Space</strong> Needs<br />
Department<br />
Current<br />
ASF<br />
Current ASF<br />
Need<br />
Difference<br />
Z. Smith Reynolds Library 117,537 160,270 -42,733<br />
Theatre and Dance 26,631 34,807 -8,176<br />
English 11,804 19,063 -7,259<br />
Chemistry 34,008 40,380 -6,372<br />
Physics 24,246 28,709 -4,463<br />
Alumni Activities 2,286 5,248 -2,962<br />
Political Science 5,223 8,000 -2,777<br />
University Stores 16,311 18,685 -2,374<br />
School of Law 82,799 85,083 -2,284<br />
Student Financial Aid 1,691 3,498 -1,807<br />
Philosophy 3,568 5,365 -1,797<br />
<strong>Facilities</strong> Management 15,619 17,382 -1,763<br />
Development 2,782 4,424 -1,642<br />
History 6,838 8,455 -1,617<br />
Future <strong>Space</strong> Needs<br />
Three scenarios of projected space needs were developed by applying<br />
across-the-board increases to the undergraduate enrollments of the College<br />
and the Calloway School of Business and Accountancy. Enrollments in the<br />
professional schools are assumed to remain stable <strong>for</strong> this planning period<br />
and there<strong>for</strong>e no future space needs have been developed <strong>for</strong> those areas.<br />
The three enrollment levels included increases of 7%, 12.5% and 25%.<br />
Table 13 summarizes the findings which are presented <strong>for</strong> each projected<br />
enrollment level:<br />
7% Undergraduate Growth Scenario<br />
• Under this scenario the aggregate space needs <strong>for</strong> the campus are<br />
expected to total 1,040,600 ASF.<br />
• Assuming existing instructional space is retained to address future<br />
growth, the “real” future space deficit <strong>for</strong> the College will be<br />
approximately 41,900 ASF, while the “real” need <strong>for</strong> Calloway will be<br />
abut 3,050 ASF.<br />
• The greatest area of space deficiciency in the College will be in offices<br />
(23,900 ASF), followed by research labs (13,140 ASF), and then Other<br />
support space (4,830 ASF).<br />
• The greatest area of space deficiency <strong>for</strong> Calloway will be in offices<br />
(2,770 ASF).<br />
Table 13: Future <strong>Space</strong> Needs Scenarios<br />
Division<br />
Current<br />
ASF<br />
7% UG<br />
Growth<br />
Scenario<br />
Diff<br />
12.5% UG<br />
Growth<br />
Scenario<br />
Comprehensive <strong>Facilities</strong> Planning, Inc. October 2007 12<br />
Diff<br />
25% UG<br />
Growth<br />
Scenario<br />
President 2,480 2,239 241 2,239 241 2,239 241<br />
VP Investments 1,739 2,210 -471 2,210 -471 2,210 -471<br />
VP Student Life 61,169 57,324 3,845 57,575 3,594 58,144 3,025<br />
VP General Counsel 1,619 1,719 -100 1,719 -100 1,719 -100<br />
VP Advancement 17,989 20,796 -2,807 20,796 -2,807 20,796 -2,807<br />
VP Administration 51,630 55,768 -4,138 55,768 -4,138 55,768 -4,138<br />
Sr. VP Finance 26,238 30,259 -4,021 30,259 -4,021 30,259 -4,021<br />
Provost 680,565 752,694 -72,129 769,603 -89,038 807,568 -127,003<br />
Athletics 43,609 43,340 269 43,340 269 43,340 269<br />
Campus wide Support 37,770 74,246 -36,476 75,617 -37,847 78,596 -40,826<br />
Total 924,808 1,040,595 -115,787 1,059,126 -134,318 1,100,639 -175,831<br />
Diff
<strong>Wake</strong> Forest <strong>Space</strong> <strong>Utilization</strong> <strong>Study</strong><br />
Project Scope and Summation of Findings<br />
12.5% Undergraduate Growth Scenario<br />
• Under this scenario the aggregate space needs <strong>for</strong> the campus are<br />
expected to total 1,059,126 ASF.<br />
• Assuming existing instructional space is retained to address future<br />
growth, the “real” future space deficit <strong>for</strong> the College will be<br />
approximately 51,400 ASF, while the “real” need <strong>for</strong> Calloway will be<br />
abut 3,400 ASF.<br />
• The greatest area of space deficiciency in the College will be in offices<br />
(29,990 ASF), followed by research labs (16,200 ASF) and then Other<br />
support space (5,200 ASF).<br />
• The greatest area of space deficiency <strong>for</strong> Calloway will be in offices<br />
(3,265 ASF).<br />
25% Undergraduate Growth Scenario<br />
• Under this scenario the aggregate space needs <strong>for</strong> the campus are<br />
expected to total 1,100,640 ASF.<br />
• Assuming existing instructional space is retained to address future<br />
growth, the “real” future space deficit <strong>for</strong> the College will be<br />
approximately 78,100 ASF, while the “real” need <strong>for</strong> Calloway will be<br />
abut 4,900 ASF.<br />
• The greatest area of space deficiciency in the College will be in offices<br />
(43,740 ASF), followed by research labs (22,950 ASF), Other support<br />
space (68,970 ASF), and then instructional labs (5,300 ASF).<br />
• The greatest area of space deficiency <strong>for</strong> Calloway will be in offices<br />
(4,400 ASF).<br />
Detailed summaries <strong>for</strong> the projected space needs scenarios are presented in<br />
the Appendix. Detailed space needs reports <strong>for</strong> each department included in<br />
the project scope on on-file with <strong>Facilities</strong> Management and are available<br />
<strong>for</strong> review.<br />
Classroom Analysis<br />
A focused analysis of the classrooms was completed as part of the space<br />
needs assessment. The following section presents a detailed analysis <strong>for</strong> the<br />
University’s classroom facilities.<br />
Overview of Current Classroom Supply<br />
There are 159 rooms classified as classrooms, lecture halls or seminar<br />
rooms. The University has 116 classrooms, 12 Lecture halls and 31<br />
seminar rooms in its classroom supply. The total square feet of classrooms<br />
is 112,237 that contain 5,788 seats. The average room size is 706 ASF;<br />
average station size is 19.4 ASF and the average number of seats per room<br />
is 36. See the Appendix <strong>for</strong> details of the classroom existing supply per<br />
room type.<br />
In addition, three of these rooms had no regularly scheduled classes<br />
reported in the class file <strong>for</strong> Fall 2006. Winston Hall 236 and Collins Hall<br />
C007 and C008 were excluded from this analysis. Table 14 below<br />
summarizes this adjusted inventory by college:<br />
Table 14: Classroom Inventory by College<br />
College No. of Rooms ASF Seats<br />
Dean of the College 120 77,000 4,186<br />
Calloway School 13 11,736 471<br />
School of Law 11 10,354 520<br />
Babcock Graduate School 6 7,171 335<br />
Divinity School 5 3,563 172<br />
Other 1 796 42<br />
Total 156 110,620 5,726<br />
*Z. Reynolds Library – Room 476 is not assigned to a college<br />
Comprehensive <strong>Facilities</strong> Planning, Inc. October 2007 13
<strong>Wake</strong> Forest <strong>Space</strong> <strong>Utilization</strong> <strong>Study</strong><br />
Project Scope and Summation of Findings<br />
Fall 2006 <strong>Utilization</strong> Profile<br />
Classroom utilization derives from two index measures: Weekly Room<br />
Hours (WRH), the number of hours each classroom is used per week <strong>for</strong><br />
regularly scheduled classes and Station Occupancy (SO), the percent of<br />
seats occupied when a classroom is used <strong>for</strong> a regularly scheduled course.<br />
A summary profile of the classroom utilization from the Fall 2006 semester<br />
is presented in Table 15 below:<br />
Table 15: Fall 2006 <strong>Utilization</strong><br />
College<br />
Avg. WRH<br />
Avg. Station<br />
Occup.<br />
Avg. Section<br />
Size<br />
Dean of the College 20.1 61.9% 21.8<br />
Calloway School 19.9 71.6% 26.4<br />
School of Law 20.8 65.8% 28.6<br />
Babcock Graduate School 23.9 58.7% 32.9<br />
Divinity School 13.5 63.7% 19.6<br />
Other 15.0 54.6% 21.6<br />
Total 20.0 63.0% 23.1<br />
For the total campus there were 156 classrooms with scheduled classes <strong>for</strong><br />
Fall 2006. These rooms were used an average of 20 hours per week, which<br />
is on the low side of expected utilization <strong>for</strong> general purpose classrooms.<br />
The station occupancy percentage of 63% is in the range of most utilization<br />
guidelines. It is interesting to note that the utilization rates among the<br />
colleges are reasonably consistent.<br />
Ninety five percent of the classroom instruction takes place during the day<br />
(8AM to 5 PM). The classrooms are used 19 hours, which is only 44% of<br />
the 43 available hours. Prime time (9AM to 3 PM) does not show much<br />
improvement with an average use of 53% (15.9 hours) of the available<br />
hours during this time frame.<br />
be used about 27 hours during the day. If that guideline is applied to the<br />
Fall 2006 instructional load then only about 4,465 seats would have been<br />
required to meet the demand as compared to the 5,726 currently available<br />
seats. This would result in a reduction of about 25,200 square feet of<br />
classroom space. However, the outstanding space planning question to be<br />
addressed is what the impact on the classroom facilities are if the<br />
undergraduate enrollments increase by approximately 25% or to about<br />
5,000 students. The analysis to address this issue is presented in the<br />
following section.<br />
Impact of 25% Undergraduate Enrollment Growth<br />
Enrollment increases can be handled in several ways: 1) increase the class<br />
section enrollments (increases the station occupancy percentage); 2) add<br />
new sections (increases the weekly room hour utilization); 3) increase the<br />
classroom supply; 4) or combinations of these options.<br />
The number of classrooms and square feet of classrooms is dependent on<br />
the following factors: instructional demand (number of hours per week<br />
students spend in classrooms – WSCH), the utilization rate of the<br />
classrooms (average hours per week the classrooms are expected to be used<br />
–WRH times the expected station occupancy rate – SO), the average station<br />
size and the average section size.<br />
Planning Assumptions:<br />
• Instructional demand will increase by 25% across the board <strong>for</strong><br />
undergraduates only;<br />
• Weekly Room Hour goal is 25 hours per week<br />
• Station Occupancy goal is 65% (Average section size may need to<br />
increase to achieve this goal.)<br />
• Average station size is 20 square feet<br />
• The analysis is limited to the two undergraduate colleges: The<br />
College and the Calloway School of Business and Accountancy.<br />
Most classroom utilization guidelines suggest that classrooms be used at<br />
least 60% of the available hours with a station occupancy percentage of at<br />
least 60%. Following these guidelines suggests that the classrooms should<br />
Comprehensive <strong>Facilities</strong> Planning, Inc. October 2007 14
<strong>Wake</strong> Forest <strong>Space</strong> <strong>Utilization</strong> <strong>Study</strong><br />
Project Scope and Summation of Findings<br />
Dean of the College<br />
Table 16 presents the calculation of the number of classroom seats required<br />
to meet the planned increase in instructional demand <strong>for</strong> The College. The<br />
number of seats is governed by the utilization of the classrooms (average<br />
weekly room hour of use times the station occupancy). The number of seats<br />
multiplied by the average station size determines the square feet of<br />
classroom space.<br />
Table 16: Classroom Seats Calculation – The College<br />
Current (Fall 2006) Option 1 Option 2<br />
Total Rooms 120 120 120<br />
Total Enrolled 17,451 21,814 21,814<br />
WSCH 52,116 65,145 65,145<br />
Average WRH 20.1 25 25<br />
Stat. Occupancy 61.9% 61.9% 65.0%<br />
Total WRH 2,412 3,007 2,992<br />
Total Section 801 999 994<br />
Hours/Section* 3.0 3.0 3.0<br />
Section Size* 21.8 21.8 22.0<br />
Total Seats 4,186 4,210 4,009<br />
Seats/Room.* 34.9 35.0 33.5<br />
Station Size* 18.4 18.3 19.2<br />
ASF 77,000 77,000 77,000<br />
* Denotes average size<br />
Option 1: Enrollment and WSCH increase by 25%; WRH goal - 25; current SO<br />
Option 2: Enrollment and WSCH increase by 25%; WRH goal - 25; SO goal - 65%<br />
Two options are presented. In both options a 25% increase in enrollments<br />
is assumed. Option 1 applies an average weekly room hour (WRH) goal of<br />
25 hours per week but keeps the station occupancy at the current level of<br />
61.9%. Option 2 assumes an average weekly room hour (WRH) goal of 25<br />
hours per week but increases the station occupancy to 65%.<br />
Option 1 shows that the increased enrollment would only require a few<br />
more seats (24) than current while Option 2 shows that the increased<br />
enrollment could be accommodated in about 175 fewer seats. Both options<br />
would require an increase of nearly 200 sections but the average section<br />
sizes would remain essentially the same at the current average or about 22<br />
students per section.<br />
Since the calculated number of seats required <strong>for</strong> both options is reasonably<br />
close to the current classroom supply there is no reason to make major<br />
changes to the supply. Option 2 would permit the removal of few seats that<br />
would increase the station size to 19.2. Note: if the station is increased to<br />
20 square feet then the classroom supply would need to be increased by<br />
about 3,000 square feet.<br />
Size Range Analysis: Dean of the College<br />
This analysis examines number of classrooms by seat capacity size range<br />
and compares the number of weekly room hours of demand in that size<br />
range to determine surplus (+) or a need (-) <strong>for</strong> classrooms in that size<br />
range.<br />
Table 17: Needs by Size Range: The College<br />
Size Range Current Rooms Calculated Need Difference<br />
1-19 25 37 -12<br />
20-29 31 46 -15<br />
30-39 30 22 8<br />
40-49 17 10 7<br />
50-59 6 2 4<br />
60-69 2 1 1<br />
70-99 5 0 5<br />
100-129 2 1 1<br />
130+ 2 1 1<br />
Totals 120 120 0<br />
As Table 17 shows the need <strong>for</strong> 12 rooms in Size Range 1and 15 rooms in<br />
Size Range 2 can be met by the surplus of rooms in the larger size ranges.<br />
There<strong>for</strong>e, the current mix of rooms can accommodate the planned<br />
enrollment increase. However, when classrooms are remodeled or new<br />
rooms are constructed, rooms of capacity 25 or 30 should be considered.<br />
Comprehensive <strong>Facilities</strong> Planning, Inc. October 2007 15
<strong>Wake</strong> Forest <strong>Space</strong> <strong>Utilization</strong> <strong>Study</strong><br />
Project Scope and Summation of Findings<br />
In summary the current classroom will support an enrollment increase of<br />
25% across the board if the average weekly room hour (WRH) is increased<br />
from 20 hours per week to 25 hours per week and the station occupancy<br />
remains at its current rate or higher.<br />
Calloway School of Business<br />
Table 18 presents the calculation of the number of classroom seats required<br />
to meet the planned increase in instructional demand <strong>for</strong> the Calloway<br />
School. The number of seats is governed by the utilization of the<br />
classrooms (average weekly room hour of use times the station occupancy).<br />
The number of seats times the average station size determines the square<br />
feet of classroom space.<br />
Table 18: Classroom Seats Calculation – Calloway School of Business<br />
Current (Fall 2006) Option 1 Option 2<br />
Total Rms. 13 13 13<br />
Tot. Enroll 2,244 2,805 2,805<br />
WSCH 6,717 8,396 8,396<br />
Avg. WRH 19.9 25 25<br />
Stat. Occ. 71.6% 71.6% 65%<br />
Tot. WRH 259 324 380<br />
Tot. Sect. 85 106 125<br />
Hrs/Sect.* 3 3 3<br />
Sect. Size* 26.4 26.4 22.5<br />
Tot. Seats 471 469 517<br />
Seats/Rm.* 36.2 36.2 34<br />
Stat. Size* 24.9 25 25<br />
ASF 11,736 11,727 12,917<br />
* Denotes average size<br />
Option 1: enrollment and WSCH increase by 25%; WRH goal - 25; current SO<br />
Option 2: enrollment and WSCH increase by 25%; WRH goal - 25; SO goal - 65%<br />
Two options are presented. In both options the 25% enrollment increase is<br />
assumed. Option 1 assumes an average weekly room hour (WRH) goal of<br />
25 hours per week but keeps the station occupancy at the current level of<br />
71.6%. Option 2 assumes an average weekly room hour (WRH) goal of 25<br />
hours per week but decreases the station occupancy to 65%.<br />
Option 1 shows that the increased enrollment would not require any more<br />
seats than current, while Option 2 shows that the increased enrollment<br />
would require 46 more seats. Option 1 would require 21 more sections but<br />
the average section size would remain constant at about 26.4 students.<br />
Option 2, because of the decrease in station occupancy, would require 40<br />
more sections and the average section size would be reduced by about 4<br />
students per section.<br />
Option 1 can be accommodated in the current classroom supply, but Option<br />
2 would require two more classrooms as shown in Table 10.<br />
Size Range Analysis: Calloway School of Business<br />
This analysis examines number of classrooms by seat capacity size range<br />
and compares the number of weekly room hours of demand in that size<br />
range to determine surplus (-) or a need (+) <strong>for</strong> classrooms in that size<br />
range.<br />
Table 19: Needs by Size Range: Calloway School of Business<br />
Size Range Current Rooms Calculated Need Difference<br />
1-19 2 2 0<br />
20-29 5 7 -2<br />
30-39 0 3 -3<br />
40-49 5 1 4<br />
50-59 0 1 -1<br />
60-69 0 1 -1<br />
70-99 1 0 1<br />
100-129 0 0 0<br />
130+ 0 0 0<br />
Totals 13 15 -2<br />
As shown in Table 19 there is an overall need <strong>for</strong> two classrooms. These<br />
classrooms should be in the 50 to 70 capacity range. Note: if the station<br />
occupancy remains at its current rate of about 71% then the current supply<br />
can accommodate the planned enrollment increase.<br />
In summary the current Calloway classrooms will support an enrollment<br />
increase of 25% across the board if the average weekly room hour (WRH)<br />
Comprehensive <strong>Facilities</strong> Planning, Inc. October 2007 16
<strong>Wake</strong> Forest <strong>Space</strong> <strong>Utilization</strong> <strong>Study</strong><br />
Project Scope and Summation of Findings<br />
is increased from 20 hours per week to 25 hours per week and the station<br />
occupancy remains at its current rate of 71.6% or higher. However, if the<br />
station occupancy is reduced from 71.6% to 65% then two additional<br />
classrooms would be needed.<br />
Classroom Analysis: Summary of Conclusions<br />
Based on most published space planning guidelines, the departmental<br />
classrooms at <strong>Wake</strong> Forest are underutilized even in the prime time. Most<br />
guidelines recommend a weekly room hour utilization of at least 60% of the<br />
available hours. For a standard 8 AM to 5 PM week (45 available hours)<br />
this translates into a utilization of at least 27 hours per week. The Fall 2006<br />
utilization <strong>for</strong> all rooms <strong>for</strong> the 8 to 5 time frame is just under 20 hours per<br />
week. The station occupancy is better at approximately 63% of the seats<br />
used when the classroom is occupied. This is in the low range of most<br />
guidelines which state station occupancy should be in the range of 60% to<br />
70%.<br />
Dean of the College<br />
The current classrooms will support an enrollment increase of 25% across<br />
the board if the average weekly room hour (WRH) is increased from 20<br />
hours per week to 25 hours per week and the station occupancy remains at<br />
its current rate of 61.9%.or higher. Size range analysis shows that the<br />
current mix of rooms can accommodate the planned enrollment increases.<br />
However, when classrooms are remodeled or new rooms are constructed,<br />
rooms of capacity 25 or 30 should be considered.<br />
Calloway School of Business<br />
The current classrooms will support an enrollment increase of 25% across<br />
the board if the average weekly room hour (WRH) is increased from 20<br />
hours per week to 25 hours per week and the station occupancy remains at<br />
its current rate of 71.6% or higher. However, if the station occupancy is<br />
reduced from 71.6% to 65% then two additional classrooms would be<br />
needed. These classrooms should be in the 50 to 70 capacity range. Note: if<br />
the station occupancy remains at its current rate of about 71% then the<br />
current supply can accommodate the planned enrollment increase.<br />
Comprehensive <strong>Facilities</strong> Planning, Inc. October 2007 17
<strong>Wake</strong> Forest <strong>Space</strong> <strong>Utilization</strong> <strong>Study</strong><br />
Project Scope and Summation of Findings<br />
<strong>Space</strong> Management<br />
<strong>Wake</strong> Forest currently has no <strong>for</strong>mal space management practices or<br />
organization. As part of this assessment CFP has developed companion<br />
documents to this report that provide a recommended structure, policies,<br />
procedures and space planning guidelines that the University may use in<br />
developing a more <strong>for</strong>mal process <strong>for</strong> managing its space resources. The<br />
following is an excerpt from these reports, which are available <strong>for</strong> review<br />
through <strong>Facilities</strong> Management.<br />
<strong>Space</strong> management is a decision making process that gives direction <strong>for</strong><br />
managing and providing adequate space <strong>for</strong> administrative and academic<br />
units. Effective space management is critical in maximizing the use of<br />
available resources and includes the unit assignment, building inventory,<br />
utilization, modification and evaluation of academic and administrative<br />
facilities on the campus.<br />
All space should be considered a valuable University resource and its use<br />
and disposition is to be thoughtfully considered. No space assignment<br />
should be considered exempt from periodic review of use; it is essential that<br />
use can be justified to insure continued relevance to the University’s<br />
mission and goals.<br />
Guiding Principles <strong>for</strong> <strong>Space</strong> Management<br />
The following principles may be followed to guide the University’s space<br />
management ef<strong>for</strong>ts:<br />
• Creation and the maintenance of the University’s space inventory<br />
should be considered a high priority.<br />
• <strong>Space</strong> should be considered as much a University resource as<br />
faculty and staff or budget dollars. The physical facilities of the<br />
University are an enormous asset crucial to the operations of the<br />
campus.<br />
• <strong>Space</strong> is a University property to be allocated in a manner which<br />
best advances University priorities.<br />
• University space can and should be reassigned as required by<br />
objective criteria to meet justifiable needs.<br />
• University space needs will be evaluated in the context of<br />
traditional quantitative and functional considerations.<br />
• Responsibility <strong>for</strong> assignment and reassignment of space should<br />
generally follow divisional and departmental organizational<br />
hierarchies. While any and all space assignments are subject to<br />
change based on the authority of the President and/or Provost, the<br />
ability to assign and reassign space is generally delegated to each<br />
of the Deans and Vice Presidents <strong>for</strong> their respective departments<br />
and programs.<br />
The University’s space management process may consist of the following<br />
functions/areas:<br />
<strong>Space</strong> Inventory: One of the most important and valuable resources at the<br />
University are its facilities. An accurate space inventory is the essential<br />
backbone of any space management system. The goal of a space inventory<br />
is to identify, document, and allocate space <strong>for</strong> all institutional programs<br />
and activities. A space inventory system that organizes and manages the<br />
institutional space resources is fundamental in order to meet this goal. It<br />
ensures that the space is effectively and efficiently used to meet the overall<br />
academic, administrative, and support needs and objectives; ensures that<br />
each unit has sufficient space to fulfill its mission; maintains reasonable<br />
equality of space among similar functions of the different units; provides a<br />
record of how space is allocated or assigned; provides the ability to respond<br />
to new opportunities; and ensures that space is put to its best and most<br />
productive use.<br />
<strong>Space</strong> Audit/Surveys: Verification of the space inventory records, via a<br />
space survey or audit, should be implemented on regular cycle. This is<br />
needed to validate, correct and update the building and room records<br />
following new construction, renovation, and/or reassignments. This survey<br />
or audit should be conducted as a self-audit by each department. As a self<br />
audit, academic and administrative units will submit changes to the room<br />
use, classification, and assignment data though an annual space update <strong>for</strong>m<br />
that can be electronic or web based. An accurate space inventory provides<br />
the basis <strong>for</strong> realistic space needs calculations; fulfills required reporting;<br />
Comprehensive <strong>Facilities</strong> Planning, Inc. October 2007 18
<strong>Wake</strong> Forest <strong>Space</strong> <strong>Utilization</strong> <strong>Study</strong><br />
Project Scope and Summation of Findings<br />
and provides the University with accurate data <strong>for</strong> the assignment and<br />
management of the campus space.<br />
<strong>Space</strong> <strong>Utilization</strong>/Need: Along with the inventory, the space management<br />
process is used to determine the effective use of space and to look <strong>for</strong><br />
opportunities in increase the efficient use of resources. This is done through<br />
an evaluation/analysis of existing space through the use of space needs<br />
calculations. These calculations are based on the University’s space<br />
planning guidelines and general planning assumptions that are reasonable<br />
and accepted by the University. These guidelines shall be periodically<br />
reviewed and updated as programs, teaching and learning pedagogies, and<br />
technological advances continue to evolve and influence the University’s<br />
physical environment.<br />
<strong>Space</strong> Assignment: <strong>Space</strong> is one of the University’s most valued resources,<br />
so relevance to the University’s <strong>Academic</strong>/Strategic Plan and to the<br />
University’s mission are key considerations in resolving space requests.<br />
Because square footage requests usually exceed the amount of available<br />
space, units are strongly encouraged to manage their space as effectively as<br />
possible. When space needs exceed the current allocation of space a<br />
process should be in place to reallocate or reassign space based on a set of<br />
established criteria.<br />
Capital Planning: Capital Planning is a key element to <strong>Wake</strong> Forest<br />
University’s facilities. Planning <strong>for</strong> capital development should involve the<br />
integration of space demands, financing, and the long range plans of the<br />
organization. The University should prepare a capital plan that establishes<br />
the priority projects <strong>for</strong> the budget cycle. Input to the plan includes priority<br />
projects that were not funded in the last budget cycle and still are a priority<br />
<strong>for</strong> the University, plus new projects that are physically and financially<br />
feasible. The number of worthy projects generally far exceeds available<br />
funds; hence funding priorities become an important part of this process.<br />
Comprehensive <strong>Facilities</strong> Planning, Inc. October 2007 19
<strong>Wake</strong> Forest <strong>Space</strong> <strong>Utilization</strong> <strong>Study</strong><br />
Project Scope and Summation of Findings<br />
Conclusions<br />
The following section summarizes the conclusions and results from the<br />
<strong>Wake</strong> Forest space utilization study:<br />
• The current calculated space needs <strong>for</strong> the total campus indicates a net<br />
deficit of 9.2% or about 85,300 ASF. This deficit is mostly in<br />
administrative support operations.<br />
• Of the nine major campus divisions, three were determined to have<br />
current needs. In the aggregate, current space <strong>for</strong> the other divisions is<br />
sufficient.<br />
• Classroom and instructional laboratory space is sufficient to meet<br />
current needs and has capacity to meet potential future growth.<br />
• Assuming the existing instructional space is retained to address future<br />
growth and is not reprogrammed to other uses, the current “real” space<br />
deficit is approximately 124,600 ASF. Research laboratory space is<br />
deficient by 9,645 ASF or about 7.7% of the current need. Office space<br />
is currently about 20% deficient or about 25,500 ASF. Library space is<br />
the largest component of the space type deficit or 40% of the “real”<br />
need. Campus support space constitutes about 28% of the need.<br />
7% Undergraduate Growth Scenario<br />
• Under this scenario the aggregate space needs <strong>for</strong> the campus are<br />
expected to total 1,040,600 ASF. Assuming existing instructional<br />
space is retained to address future growth, the “real” future space<br />
deficit <strong>for</strong> the College will be approximately 41,900 ASF, while the<br />
“real” need <strong>for</strong> Calloway will be abut 3,050 ASF.<br />
25% Undergraduate Growth Scenario<br />
• Under this scenario the aggregate space needs <strong>for</strong> the campus are<br />
expected to total 1,100,640 ASF.<br />
• Assuming existing instructional space is retained to address future<br />
growth, the “real” future space deficit <strong>for</strong> the College will be<br />
approximately 78,100 ASF, while the “real” need <strong>for</strong> Calloway will be<br />
abut 4,900 ASF.<br />
• Based on most published space planning guidelines, the classrooms at<br />
<strong>Wake</strong> Forest are underutilized even in the prime time.<br />
• The classrooms assigned to the Dean of the College will support an<br />
enrollment increase of 25% across the board if the average weekly<br />
room hour (WRH) is increased from 20 hours per week to 25 hours per<br />
week and the station occupancy remains at its current rate of 61.9%.or<br />
higher. Size range analysis shows that the current mix of rooms can<br />
accommodate the planned enrollment increases.<br />
• The classrooms assigned to the Calloway School will support an<br />
enrollment increase of 25% across the board if the average weekly<br />
room hour (WRH) is increased from 20 hours per week to 25 hours per<br />
week and the station occupancy remains at its current rate of 71.6% or<br />
higher. However, if the station occupancy is reduced from 71.6% to<br />
65% then two additional classrooms would be needed. If the station<br />
occupancy remains at its current rate of about 71% then the current<br />
supply can accommodate the planned enrollment increase.<br />
12.5% Undergraduate Growth Scenario<br />
• Under this scenario the aggregate space needs <strong>for</strong> the campus are<br />
expected to total 1,059,125 ASF. Assuming existing instructional<br />
space is retained to address future growth, the “real” future space<br />
deficit <strong>for</strong> the College will be approximately 51,400 ASF, while the<br />
“real” need <strong>for</strong> Calloway will be abut 3,400 ASF.<br />
Comprehensive <strong>Facilities</strong> Planning, Inc. October 2007 20
<strong>Wake</strong> Forest <strong>Space</strong> <strong>Utilization</strong> <strong>Study</strong><br />
Project Scope and Summation of Findings<br />
Recommendations<br />
The University should consider implementing a <strong>for</strong>mal space management<br />
process that includes:<br />
• Periodic updating of its space inventory database through both selfreporting<br />
by departments and field audits.<br />
• Implementing a space allocation procedure to address needs that cannot<br />
be met within the management of a particular college.<br />
• Periodically updating its space needs calculations as input into future<br />
capital planning.<br />
Consideration should also be given <strong>for</strong> establishing an office responsible <strong>for</strong><br />
the coordination of these ef<strong>for</strong>ts.<br />
Should the University periodically update these space needs, modifications<br />
to the type of data and <strong>for</strong>mats used in the process should be review and<br />
implemented. The current study required significant supplementation and<br />
manipulation of some of the data to generate the model. Updating the space<br />
needs will require similar ef<strong>for</strong>ts unless improved database coordination and<br />
<strong>for</strong>matting is achieved. Improvements to the basic data inputs include:<br />
• Developing a class file that requires the reporting of all scheduled<br />
instructional activity in University-owned space.<br />
• A consolidation of reporting from all colleges by course of all student<br />
credit hours by term and course designation.<br />
• Creating a comprehensive personnel database that includes not only all<br />
full time employees, but also non-university, student employees and<br />
graduate assistants.<br />
The University should consider investing in database management software<br />
systems <strong>for</strong> maintaining their space inventory and other facilities data, as<br />
well as scheduling software <strong>for</strong> classrooms and other facilities.<br />
Comprehensive <strong>Facilities</strong> Planning, Inc. October 2007 21
<strong>Wake</strong> Forest <strong>Space</strong> <strong>Utilization</strong> <strong>Study</strong> Appendices<br />
Appendices<br />
<strong>Space</strong> Needs Summaries<br />
Classroom Analysis: Detailed Data<br />
Comprehensive <strong>Facilities</strong> Planning, Inc. October 2007 22
<strong>Wake</strong> Forest <strong>Space</strong> <strong>Utilization</strong> <strong>Study</strong> Appendices<br />
<strong>Space</strong> Needs Summaries<br />
Chart SN1<br />
Current <strong>Space</strong> vs. Current Needs and Growth Scenarios<br />
by Major Division<br />
1,200,000<br />
1,150,000<br />
1,100,000<br />
1,050,000<br />
1,000,000<br />
950,000<br />
900,000<br />
850,000<br />
Square Feet<br />
800,000<br />
750,000<br />
700,000<br />
650,000<br />
600,000<br />
550,000<br />
500,000<br />
450,000<br />
400,000<br />
350,000<br />
300,000<br />
250,000<br />
200,000<br />
150,000<br />
100,000<br />
50,000<br />
0<br />
President VP Investments VP Student Life<br />
VP General<br />
Counsel<br />
VP Advancement<br />
VP<br />
Administration<br />
Sr. VP Finance Provost Athletics Campusw ide Total<br />
Current ASF 2,480 1,739 61,169 1,619 17,989 51,630 26,238 680,565 43,609 37,770 924,808<br />
Current Need 2,239 2,210 56,881 1,719 20,796 55,768 30,259 724,703 43,340 72,194 1,010,109<br />
7% UG Growth 2,239 2,210 57,324 1,719 20,796 55,768 30,259 752,694 43,340 74,246 1,040,595<br />
12.5% UG Grow th 2,239 2,210 57,575 1,719 20,796 55,768 30,259 769,603 43,340 75,617 1,059,126<br />
25% UG Growth 2,239 2,210 58,144 1,719 20,796 55,768 30,259 807,568 43,340 78,596 1,100,639<br />
Comprehensive <strong>Facilities</strong> Planning, Inc. October 2007 23
<strong>Wake</strong> Forest <strong>Space</strong> <strong>Utilization</strong> <strong>Study</strong> Appendices<br />
Chart SN2<br />
Current <strong>Space</strong> vs. Current Needs and Growth Scenarios<br />
by College<br />
Square Feet<br />
650,000<br />
625,000<br />
600,000<br />
575,000<br />
550,000<br />
525,000<br />
500,000<br />
475,000<br />
450,000<br />
425,000<br />
400,000<br />
375,000<br />
350,000<br />
325,000<br />
300,000<br />
275,000<br />
250,000<br />
225,000<br />
200,000<br />
175,000<br />
150,000<br />
125,000<br />
100,000<br />
75,000<br />
50,000<br />
25,000<br />
0<br />
Divinity School School of Law Babcock Grad School Calloway The College Totals<br />
Current ASF 16,813 82,799 32,739 2,376 27,191 384,468 546,386<br />
Current Need 14,013 85,083 30,403 2,773 23,733 386,386 542,391<br />
7% UG Growth 14,013 85,083 30,403 2,773 24,954 404,946 562,172<br />
12.5% UG Growth 14,013 85,083 30,403 2,773 25,841 419,831 577,944<br />
25% UG Growth 14,013 85,083 30,403 2,773 27,859 453,436 613,567<br />
Comprehensive <strong>Facilities</strong> Planning, Inc. October 2007 24
<strong>Wake</strong> Forest <strong>Space</strong> <strong>Utilization</strong> <strong>Study</strong> Appendices<br />
Chart SN3<br />
Variance Between Current <strong>Space</strong> and Calculated <strong>Space</strong> Needs by <strong>Space</strong> Type<br />
Dean of the College<br />
40,000<br />
Square Feet - Deficit (-) / Surplus (+)<br />
20,000<br />
0<br />
-20,000<br />
-40,000<br />
-60,000<br />
-80,000<br />
Offices Classrooms Instructional Labs Research Labs Other Net Total<br />
Current ASF Minus Current Need -16,235 22,532 5,741 -9,645 -4,310 -1,918<br />
Current ASF Minus 7% Growth Need -23,937 18,781 2,646 -13,140 -4,829 -20,478<br />
Current ASF Minus 12.5% Growth Need -29,988 15,833 216 -16,205 -5,220 -35,363<br />
Current ASF Minus 25% Growth Need -43,740 9,139 -5,308 -22,950 -6,109 -68,968<br />
Comprehensive <strong>Facilities</strong> Planning, Inc. October 2007 25
<strong>Wake</strong> Forest <strong>Space</strong> <strong>Utilization</strong> <strong>Study</strong> Appendices<br />
Chart SN4<br />
Variance Between Current <strong>Space</strong> and Calculated <strong>Space</strong> Needs by <strong>Space</strong> Type<br />
Calloway School of Business and Accountancy<br />
8,000<br />
Square Feet - Deficit (-) / Surplus (+)<br />
6,000<br />
4,000<br />
2,000<br />
0<br />
-2,000<br />
-4,000<br />
-6,000<br />
Offices Classrooms Instructional Labs Other Net Total<br />
Current ASF Minus Current Need -2,139 5,703 -38 -68 3,458<br />
Current ASF Minus 7% Growth Need -2,770 5,294 -82 -205 2,237<br />
Current ASF Minus 12.5% Growth Need -3,266 4,975 -117 -243 1,350<br />
Current ASF Minus 25% Growth Need -4,392 4,247 -196 -327 -668<br />
Comprehensive <strong>Facilities</strong> Planning, Inc. October 2007 26
<strong>Wake</strong> Forest <strong>Space</strong> <strong>Utilization</strong> <strong>Study</strong> Appendices<br />
Chart SN5<br />
Current <strong>Space</strong> vs. Current Needs and Growth Scenarios<br />
by <strong>Space</strong> Category<br />
1,200,000<br />
1,150,000<br />
1,100,000<br />
1,050,000<br />
1,000,000<br />
950,000<br />
900,000<br />
850,000<br />
Square Feet<br />
800,000<br />
750,000<br />
700,000<br />
650,000<br />
600,000<br />
550,000<br />
500,000<br />
450,000<br />
400,000<br />
350,000<br />
300,000<br />
250,000<br />
200,000<br />
150,000<br />
100,000<br />
50,000<br />
0<br />
Classrooms Instruct. Labs Research Labs Offices Library Special Use Stud. Lounge Oth. General Use Support Health Ctr. Total<br />
Current ASF 115,015 62,564 60,711 343,354 159,455 23,930 13,022 106,567 36,050 4,140 924,808<br />
Current Need 82,808 55,477 70,356 368,853 209,254 24,272 15,302 108,740 70,372 4,675 1,010,109<br />
7% UG Growth 86,967 58,616 73,851 377,804 217,094 24,288 15,831 108,851 72,493 4,800 1,040,595<br />
12.5% UG Growth 90,235 61,081 76,916 384,836 217,827 24,300 16,248 108,851 73,920 4,912 1,059,126<br />
25% UG Growth 97,657 66,685 83,661 400,820 219,494 24,327 17,194 108,851 76,800 5,150 1,100,639<br />
Comprehensive <strong>Facilities</strong> Planning, Inc. October 2007 27
<strong>Wake</strong> Forest <strong>Space</strong> <strong>Utilization</strong> <strong>Study</strong> Appendices<br />
Chart SN6<br />
<strong>Space</strong> Need Variance by Room Type<br />
Difference of Current <strong>Space</strong> from Current Need<br />
and Growth Scenarios<br />
85,000<br />
65,000<br />
45,000<br />
25,000<br />
5,000<br />
Deficit (-) / Surplus (+)<br />
-15,000<br />
-35,000<br />
-55,000<br />
-75,000<br />
-95,000<br />
-115,000<br />
-135,000<br />
-155,000<br />
-175,000<br />
Classrooms<br />
Instructional<br />
Labs<br />
Research Labs Offices Library Special Use<br />
Current ASF Minus Current Need 32,207 7,087 -9,645 -25,499 -49,799 -342 -2,280 -2,173 -34,322 -536 -85,302<br />
Current ASF Minus 7% Growth 28,048 3,948 -13,140 -34,450 -57,639 -358 -2,809 -2,284 -36,443 -660 -115,787<br />
Current ASF Minus 12.5% Growth 24,780 1,483 -16,205 -41,482 -58,372 -370 -3,226 -2,284 -37,870 -772 -134,318<br />
Current ASF Minus 25% Growth 17,358 -4,121 -22,950 -57,466 -60,039 -397 -4,172 -2,284 -40,750 -1,010 -175,831<br />
Student<br />
Lounge<br />
Other General<br />
Use<br />
Support Health Net Difference<br />
Comprehensive <strong>Facilities</strong> Planning, Inc. October 2007 28
<strong>Wake</strong> Forest <strong>Space</strong> <strong>Utilization</strong> <strong>Study</strong> Appendices<br />
Classroom Analysis: Detailed Data<br />
Table CR1: Current Classroom Inventory by Type<br />
Room<br />
Type<br />
Room Type<br />
Description<br />
No. of<br />
Rooms<br />
Square<br />
Feet<br />
Total<br />
Seats<br />
Average<br />
Room<br />
Size<br />
Average<br />
Seat Size<br />
Average<br />
Seats per<br />
Room<br />
110 Classroom 116 81,105 4,108 699 19.7 35<br />
120 Lecture Hall 12 17,590 1,148 1,466 15.3 96<br />
130 Seminar Room 31 13,542 530 437 25.6 17<br />
Totals 159 112,237 5,786 706 19.4 36<br />
Table CR2: Fall 2006 Classroom <strong>Utilization</strong> by College - 8 AM to 10 PM M-F<br />
College<br />
No. of<br />
Rooms ASF Seats<br />
Avg.<br />
Room<br />
Size<br />
Avg.<br />
Station<br />
Size<br />
Avg.<br />
WRH<br />
Avg.<br />
Station<br />
Occupancy<br />
Avg.<br />
Section<br />
Size<br />
Dean of the College 120 77,000 4,186 642 18.4 20.1 61.9% 21.8 1<br />
Calloway School of Business 13 11,736 471 903 24.9 19.9 71.6% 26.4 0<br />
School of Law 11 10,354 520 941 19.9 20.8 65.8% 28.6 0<br />
Babcock Graduate School of Mgmt. 6 7,171 335 1,195 21.4 23.9 58.7% 32.9 0<br />
Divinity School 5 3,563 172 713 20.7 13.5 63.7% 19.6 0<br />
Other 1 796 42 796 19.0 15.0 54.6% 21.6 2<br />
Total Reynolda Campus 156 110,620 5,726 709 19.3 20.0 63.0% 23.1 3<br />
*Z. Reynolds Library – Room 476 is not assigned to a college<br />
Rooms<br />
with No<br />
Use*<br />
Comprehensive <strong>Facilities</strong> Planning, Inc. October 2007 29
<strong>Wake</strong> Forest <strong>Space</strong> <strong>Utilization</strong> <strong>Study</strong> Appendices<br />
Table CR3: Dean of College Classroom Size Range Analysis<br />
Size Range<br />
Current<br />
Rooms<br />
Planned<br />
WRH<br />
Demand<br />
Mode<br />
Modified<br />
Demand<br />
Whole<br />
Rooms<br />
Difference<br />
1 1-19 25 1,550 62.0 37.2 37 12<br />
2 20-29 31 780 31.2 46.6 46 15<br />
3 30-39 30 461 18.4 22.3 22 -8<br />
4 40-49 17 143 5.7 10.1 10 -7<br />
5 50-59 6 36 1.4 2.3 2 -4<br />
6 60-69 2 11 0.4 0.6 1 -1<br />
7 70-99 5 9 0.3 0.4 0 -5<br />
8 100-129 2 12 0.5 0.5 1 -1<br />
9 130+ 2 4 0.1 0.2 1 -1<br />
Totals 120 3,007 120.3 120.3 120 0<br />
Table CR4: Calloway School of Business Classroom Size Range Analysis<br />
Size Range<br />
Current<br />
Rooms<br />
Planned<br />
WRH<br />
Demand<br />
Mode<br />
Modified<br />
Demand<br />
Whole<br />
Rooms<br />
Difference<br />
1 1-19 2 111 4.4 2.7 2 0<br />
2 20-29 5 196 7.8 7.3 7 2<br />
3 30-39 0 42 1.7 3.5 3 3<br />
4 40-49 5 18 0.7 1.1 1 -4<br />
5 50-59 0 9 0.4 0.4 1 1<br />
6 60-69 0 4 0.2 0.2 1 1<br />
7 70-99 1 0 0.0 0.0 0 -1<br />
8 100-129 0 0 0.0 0.0 0 0<br />
9 130-9999 0 0 0.0 0.0 0 0<br />
Totals 13 380 15.2 15.2 15 2<br />
Notes:<br />
• The Current Rooms column is a count of<br />
rooms from the room inventory based on<br />
the reported seats in each capacity size<br />
range.<br />
• The Planned WRH (weekly room hour)<br />
column is the sum of the contact hours <strong>for</strong><br />
each size range after applying the planned<br />
enrollment increase.<br />
• The Demand Mode is the number of rooms<br />
required assuming a utilization goal of 25<br />
hours per week.<br />
• The Modified Demand assumes that some<br />
of the demand “cascades” into larger size<br />
ranges to reflect more realistic scheduling<br />
patterns.<br />
• The Whole Rooms column rounds the<br />
modified rooms to whole number. For<br />
smaller size ranges this is rounded down<br />
since unmet demand can be met in a larger<br />
room.<br />
• The Difference column is the Whole<br />
Rooms minus the Current Rooms.<br />
Comprehensive <strong>Facilities</strong> Planning, Inc. October 2007 30
Comprehensive <strong>Facilities</strong> Planning, Inc. Columbus, Ohio 43209 www.cfp-planners.com

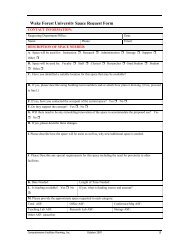
![Guidelines for care & Use of Dry Solvent Stills [Example]](https://img.yumpu.com/4958540/1/190x245/guidelines-for-care-use-of-dry-solvent-stills-example.jpg?quality=85)