Combinatorial and High-Throughput Screening of Materials ...
Combinatorial and High-Throughput Screening of Materials ...
Combinatorial and High-Throughput Screening of Materials ...

Create successful ePaper yourself
Turn your PDF publications into a flip-book with our unique Google optimized e-Paper software.
ACS <strong>Combinatorial</strong> Science<br />
REVIEW<br />
Table 2. Continued<br />
materials system instrumentation knowledge ref<br />
one-dimensional fluorescence spectroscopy <strong>and</strong> imaging for the evaluation ranking <strong>of</strong> polymer/UV absorber compositions<br />
333<br />
coiled libraries<br />
<strong>of</strong> polymer/UV<br />
absorber compositions<br />
<strong>of</strong> oxidative stability (weathering) <strong>of</strong> polymer/UV<br />
absorber compositions under accelerated test<br />
conditions. Environmental stress is applied to only local<br />
regions, followed by high-sensitivity spatially<br />
resolved characterization.<br />
equivalent to traditional weathering data while achieved<br />
20 times faster<br />
polyphasic fluid<br />
microreactor for liquid/liquid isomerization <strong>and</strong><br />
reaction rate is proportional to the catalyst concentration; 512<br />
reactions<br />
gas/liquid asymmetric hydrogenation based on<br />
dynamic sequential operation<br />
the rate decreases with increasing surfactant concentration,<br />
no change in the enantiomeric excess was observed<br />
polymer synthesis on-line GPC for reaction optimization determination <strong>of</strong> activation energy <strong>of</strong> polymerization 513<br />
siloxane rubber/<br />
carbon black<br />
nanocomposites<br />
automated scanning probe microscope<br />
study <strong>of</strong> curing rate <strong>of</strong> siloxane rubber matrix on roughness<br />
<strong>and</strong> conductivity <strong>of</strong> composites<br />
514<br />
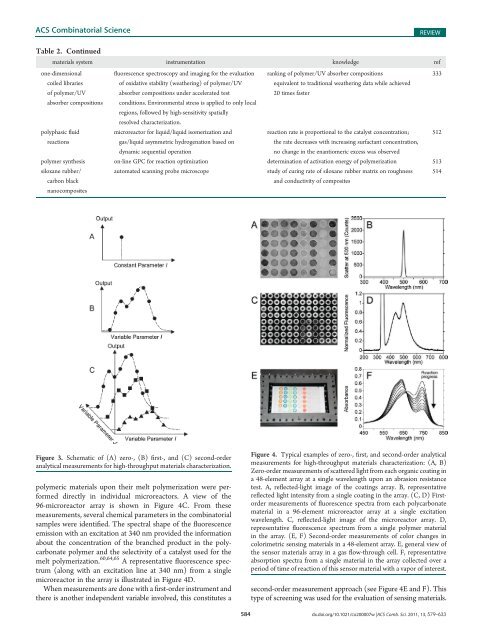
Figure 3. Schematic <strong>of</strong> (A) zero-, (B) first-, <strong>and</strong> (C) second-order<br />
analytical measurements for high-throughput materials characterization.<br />
polymeric materials upon their melt polymerization were performed<br />
directly in individual microreactors. A view <strong>of</strong> the<br />
96-microreactor array is shown in Figure 4C. From these<br />
measurements, several chemical parameters in the combinatorial<br />
samples were identified. The spectral shape <strong>of</strong> the fluorescence<br />
emission with an excitation at 340 nm provided the information<br />
about the concentration <strong>of</strong> the branched product in the polycarbonate<br />
polymer <strong>and</strong> the selectivity <strong>of</strong> a catalyst used for the<br />
melt polymerization. 60,64,65 A representative fluorescence spectrum<br />
(along with an excitation line at 340 nm) from a single<br />
microreactor in the array is illustrated in Figure 4D.<br />
When measurements are done with a first-order instrument <strong>and</strong><br />
there is another independent variable involved, this constitutes a<br />
Figure 4. Typical examples <strong>of</strong> zero-, first, <strong>and</strong> second-order analytical<br />
measurements for high-throughput materials characterization: (A, B)<br />
Zero-order measurements <strong>of</strong> scattered light from each organic coating in<br />
a 48-element array at a single wavelength upon an abrasion resistance<br />
test. A, reflected-light image <strong>of</strong> the coatings array. B, representative<br />
reflected light intensity from a single coating in the array. (C, D) Firstorder<br />
measurements <strong>of</strong> fluorescence spectra from each polycarbonate<br />
material in a 96-element microreactor array at a single excitation<br />
wavelength. C, reflected-light image <strong>of</strong> the microreactor array. D,<br />
representative fluorescence spectrum from a single polymer material<br />
in the array. (E, F) Second-order measurements <strong>of</strong> color changes in<br />
colorimetric sensing materials in a 48-element array. E, general view <strong>of</strong><br />
the sensor materials array in a gas flow-through cell. F, representative<br />
absorption spectra from a single material in the array collected over a<br />
period <strong>of</strong> time <strong>of</strong> reaction <strong>of</strong> this sensor material with a vapor <strong>of</strong> interest.<br />
second-order measurement approach (see Figure 4E <strong>and</strong> F). This<br />
type <strong>of</strong> screening was used for the evaluation <strong>of</strong> sensing materials.<br />
584 dx.doi.org/10.1021/co200007w |ACS Comb. Sci. 2011, 13, 579–633