AFM study of morphological changes associated with ...
AFM study of morphological changes associated with ...
AFM study of morphological changes associated with ...

Create successful ePaper yourself
Turn your PDF publications into a flip-book with our unique Google optimized e-Paper software.
J Solid State Electrochem (2008) 12:739–746<br />
DOI 10.1007/s10008-007-0423-0<br />
ORIGINAL PAPER<br />
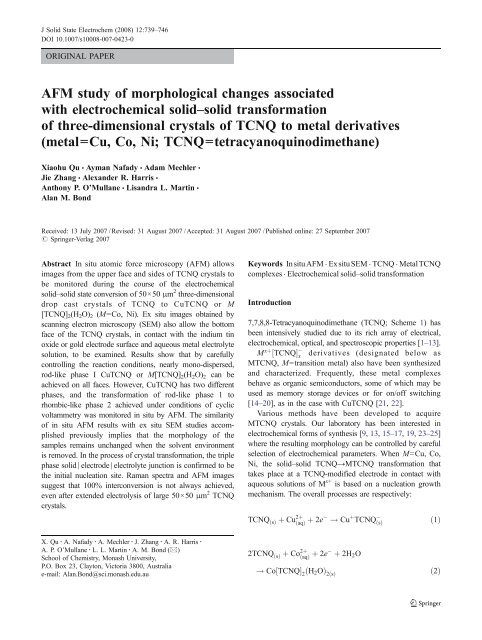
<strong>AFM</strong> <strong>study</strong> <strong>of</strong> <strong>morphological</strong> <strong>changes</strong> <strong>associated</strong><br />
<strong>with</strong> electrochemical solid–solid transformation<br />
<strong>of</strong> three-dimensional crystals <strong>of</strong> TCNQ to metal derivatives<br />
(metal=Cu, Co, Ni; TCNQ=tetracyanoquinodimethane)<br />
Xiaohu Qu & Ayman Nafady & Adam Mechler &<br />
Jie Zhang & Alexander R. Harris &<br />
Anthony P. O’Mullane & Lisandra L. Martin &<br />
Alan M. Bond<br />
Received: 13 July 2007 /Revised: 31 August 2007 /Accepted: 31 August 2007 /Published online: 27 September 2007<br />
# Springer-Verlag 2007<br />
Abstract In situ atomic force microscopy (<strong>AFM</strong>) allows<br />
images from the upper face and sides <strong>of</strong> TCNQ crystals to<br />
be monitored during the course <strong>of</strong> the electrochemical<br />
solid–solid state conversion <strong>of</strong> 50×50 μm 2 three-dimensional<br />
drop cast crystals <strong>of</strong> TCNQ to CuTCNQ or M<br />
[TCNQ] 2 (H 2 O) 2 (M=Co, Ni). Ex situ images obtained by<br />
scanning electron microscopy (SEM) also allow the bottom<br />
face <strong>of</strong> the TCNQ crystals, in contact <strong>with</strong> the indium tin<br />
oxide or gold electrode surface and aqueous metal electrolyte<br />
solution, to be examined. Results show that by carefully<br />
controlling the reaction conditions, nearly mono-dispersed,<br />
rod-like phase I CuTCNQ or M[TCNQ] 2 (H 2 O) 2 can be<br />
achieved on all faces. However, CuTCNQ has two different<br />
phases, and the transformation <strong>of</strong> rod-like phase 1 to<br />
rhombic-like phase 2 achieved under conditions <strong>of</strong> cyclic<br />
voltammetry was monitored in situ by <strong>AFM</strong>. The similarity<br />
<strong>of</strong> in situ <strong>AFM</strong> results <strong>with</strong> ex situ SEM studies accomplished<br />
previously implies that the morphology <strong>of</strong> the<br />
samples remains unchanged when the solvent environment<br />
is removed. In the process <strong>of</strong> crystal transformation, the triple<br />
phase solid∣electrode∣electrolyte junction is confirmed to be<br />
the initial nucleation site. Raman spectra and <strong>AFM</strong> images<br />
suggest that 100% interconversion is not always achieved,<br />
even after extended electrolysis <strong>of</strong> large 50×50 μm 2 TCNQ<br />
crystals.<br />
Keywords Insitu<strong>AFM</strong> . Ex situSEM . TCNQ . MetalTCNQ<br />
complexes . Electrochemical solid–solid transformation<br />
Introduction<br />
7,7,8,8-Tetracyanoquinodimethane (TCNQ; Scheme 1) has<br />
been intensively studied due to its rich array <strong>of</strong> electrical,<br />
electrochemical, optical, and spectroscopic properties [1–13].<br />
M xþ ½TCNQŠ x<br />
derivatives (designated below as<br />
MTCNQ, M=transition metal) also have been synthesized<br />
and characterized. Frequently, these metal complexes<br />
behave as organic semiconductors, some <strong>of</strong> which may be<br />
used as memory storage devices or for on/<strong>of</strong>f switching<br />
[14–20], as in the case <strong>with</strong> CuTCNQ [21, 22].<br />
Various methods have been developed to acquire<br />
MTCNQ crystals. Our laboratory has been interested in<br />
electrochemical forms <strong>of</strong> synthesis [9, 13, 15–17, 19, 23–25]<br />
where the resulting morphology can be controlled by careful<br />
selection <strong>of</strong> electrochemical parameters. When M=Cu, Co,<br />
Ni, the solid–solid TCNQ→MTCNQ transformation that<br />
takes place at a TCNQ-modified electrode in contact <strong>with</strong><br />
aqueous solutions <strong>of</strong> M x+ is based on a nucleation growth<br />
mechanism. The overall processes are respectively:<br />
TCNQ ðÞ s þ Cu 2þ ðaqÞ þ 2e ! Cuþ TCNQ ðÞ s<br />
ð1Þ<br />
X. Qu : A. Nafady : A. Mechler : J. Zhang : A. R. Harris :<br />
A. P. O’Mullane : L. L. Martin : A. M. Bond (*)<br />
School <strong>of</strong> Chemistry, Monash University,<br />
P.O. Box 23, Clayton, Victoria 3800, Australia<br />
e-mail: Alan.Bond@sci.monash.edu.au<br />
2TCNQ ðÞ s þ Co 2þ ðaqÞ þ 2e þ 2H 2O<br />
! Co½TCNQ<br />
Š 2<br />
ðH 2 O<br />
Þ 2s ðÞ<br />
ð2Þ
740 J Solid State Electrochem (2008) 12:739–746<br />
NC<br />
NC<br />
Scheme 1 7,7,8,8-Tetracyanoquinodimethane, C 12 H 4 N 4<br />
2TCNQ ðÞ s þ Ni 2þ ðaqÞ þ 2e þ 2H 2O<br />
<br />
! Ni½TCNQŠ 2<br />
ðH 2 OÞ 2<br />
ðÞ s<br />
ð3Þ<br />
The mechanistic details differ <strong>with</strong> the metal ions.<br />
However, the principle electron transfer step TCNQ ðÞ s þ<br />
e ! TCNQ : ðÞ s is dominant so that the basic features <strong>of</strong><br />
the current potential curves observed under conditions <strong>of</strong><br />
cyclic voltammetry or <strong>with</strong> other voltammetric protocols<br />
are not strongly metal ion dependent. On the basis <strong>of</strong> ex<br />
situ SEM observations [24, 25], it may be concluded that<br />
the topographies <strong>of</strong> the MTCNQ solids formed from<br />
reduction <strong>of</strong> TCNQ at an electrode surface also are<br />
similar. Thus, all electrochemically generated MTCNQ<br />
complexes appear to exhibit rod or needle-shaped structures,<br />
although their size is metal ion dependent, <strong>with</strong><br />
CuTCNQ and Co[TCNQ] 2 (H 2 O) 2 crystals being significantly<br />
longer than Ni[TCNQ] 2 (H 2 O) 2 crystals.<br />
A problem <strong>with</strong> the ex situ SEM method is that the<br />
steps <strong>of</strong> removal <strong>of</strong> the sample from the solvent and<br />
drying that are required before obtaining images may<br />
contribute to <strong>changes</strong> in the crystal morphology. Thus, in<br />
situ monitoring is needed to ensure the fidelity <strong>of</strong><br />
conclusions related to structures formed by solid–solid<br />
transformation on a TCNQ modified electrode surface.<br />
We therefore now have introduced in situ <strong>AFM</strong> imaging<br />
to monitor the morphology <strong>changes</strong> <strong>associated</strong> <strong>with</strong> the<br />
TCNQ/MTCNQ transformation at an electrode surface.<br />
Notably, previous work has utilized <strong>AFM</strong> and scanning<br />
tunneling microscopy to characterize the morphology <strong>of</strong><br />
groups I and II metal TCNQ-based materials [26–30]. In<br />
the present case, the in situ <strong>AFM</strong> method is applied to<br />
monitoring the <strong>changes</strong> at the top face and sides <strong>of</strong> large,<br />
three-dimensional TCNQ crystals when a potential is<br />
applied to a TCNQ modified electrode in contact <strong>with</strong> a<br />
transitional metal ion. To obtain a complete picture <strong>of</strong> the<br />
solid–solid state conversion, we also have examined ex<br />
situ, by SEM imaging, the bottom face <strong>of</strong> crystals that are<br />
adhered to the electrode surface.<br />
Experimental section<br />
CN<br />
CN<br />
Chemicals Analytical grade copper(II) sulfate pentahydrate,<br />
cobalt(II) nitrate hexahydrate, cobalt(II) chloride hexahydrate,<br />
nickel(II) chloride hexahydrate, 7,7′,8,8′-tetracyanoquinodimethane<br />
(TCNQ), 2-propanol, and acetone were used as<br />
received from Aldrich or Fluka. All aqueous solutions were<br />
prepared from water (resistivity <strong>of</strong> 18.2 MΩ cm) that had been<br />
purified by a Sartorius Arium 611 system. Indium tin oxide<br />
(ITO) glass (from Prazisions Glas and Optik GmbH) and goldcoated<br />
glass slides (from Arrandee) <strong>with</strong> a typical area <strong>of</strong><br />
0.20 cm 2 were used as substrates. Before use, ITO glass was<br />
cleaned by ultra-sonication for 5 min in, first, acetone and<br />
then in 2-propanol. TCNQ crystals used for both <strong>AFM</strong> and<br />
SEM electrochemical studies were prepared by drop casting<br />
20 μL <strong>of</strong> saturated TCNQ acetonitrile solution onto the<br />
substrate and allowing the solvent to evaporate from this<br />
surface at room temperature (23±2 °C). Under these<br />
conditions, many yellow-colored rhombus-like micron-sized<br />
TCNQ crystals are formed on the substrate as observed by<br />
optical microscopy (Olympus BX51M). The TCNQ modified<br />
substrate was then assembled into an electrochemical<br />
cell and served as the working electrode. During electrochemical<br />
solid–solid transformation, the rhombus-like TCNQ<br />
crystals changed in color, from yellow to dark blue. Use <strong>of</strong><br />
an optical microscope integrated <strong>with</strong> the <strong>AFM</strong> instrument<br />
allowed regions on the surface where crystals are present to<br />
be readily located. ITO is transparent in the visible region <strong>of</strong><br />
the spectrum, so it is easier to locate these dark blue crystals<br />
on the surface. For this reason, optically transparent ITO is<br />
preferred to gold as a substrate in this <strong>study</strong>. However, as<br />
electrochemical data, <strong>AFM</strong> images and Raman spectra were<br />
always found to be similar on gold and ITO substrates; no<br />
significant electrode material dependence was found.<br />
<strong>AFM</strong> images were obtained in the tapping mode using a<br />
NT-MDT Ntegra <strong>AFM</strong> instrument (NT-MDT, Russia). <strong>AFM</strong><br />
tips were <strong>of</strong> the NC36 type (<strong>with</strong>out aluminum coating) and<br />
were obtained from MikroMasch, Estonia. An Autolab μ20<br />
potentiostat (Eco Chemie, Netherlands) was used for electrochemical<br />
control. The electrochemical cell used in the in situ<br />
<strong>AFM</strong> imaging experiments was designed by NT-MDT<br />
instruments and included a built-in platinum wire counter<br />
electrode and a solid state Ag/AgCl reference electrode,<br />
whose potential is directly related to the chloride (or sulfate,<br />
nitrate) concentration in the metal salt electrolyte solution<br />
present in the electrochemical cell. The scanning electron<br />
microscope (SEM) imager was a Philips XL30 field emission<br />
gun scanning electron microscope (FEGSEM) used <strong>with</strong> an<br />
accelerating voltage <strong>of</strong> 2 keV. Raman spectra were acquired<br />
<strong>with</strong> a Renishaw Raman RM2000 instrument using a laser<br />
strength 18 mW at a wavelength <strong>of</strong> 780 nm. All experiments<br />
were accomplished at room temperature <strong>of</strong> 23±2 °C.<br />
Results and discussion<br />
It is well established [31] that application <strong>of</strong> a sufficiently<br />
negative potential can induce the conversion <strong>of</strong> TCNQ,
J Solid State Electrochem (2008) 12:739–746 741<br />
adhered on an electrode surface, to MTCNQ, in the<br />
presence <strong>of</strong> M xþ<br />
ðaqÞ<br />
. When the chemically modified electrode<br />
is in contact <strong>with</strong> the relevant metal salt solutions<br />
[16, 24, 25, 32] (M=Cu 2+ ,Co 2+ ,Ni 2+ ), electrochemically<br />
induced transformation <strong>of</strong> TCNQ to Co[TCNQ] 2 (H 2 O) 2<br />
and Ni[TCNQ] 2 (H 2 O) 2 occurs in a single step under<br />
voltammetric conditions [25, 32]. Formation <strong>of</strong> CuTCNQ<br />
represents a more complicated case because TCNQ is<br />
initially transformed to highly conductive and kinetically<br />
favored phase I CuTCNQ (rod or needle shaped crystals)<br />
and subsequently under conditions <strong>of</strong> cyclic voltammetry to<br />
less conductive, but thermodynamically stable, phase II<br />
CuTCNQ (rhombus-shaped crystals) [24].<br />
Cyclic voltammetry<br />
Figure 1 displays cyclic voltammograms obtained for the<br />
second cycle <strong>of</strong> potential at a scan rate <strong>of</strong> 20 mV s −1 when<br />
TCNQ crystals, adhered to a gold-coated slide electrode,<br />
are in contact <strong>with</strong> 0.1 M CuSO 4 , CoCl 2 , or NiCl 2 solution.<br />
The initial cycle <strong>of</strong> the potential is very complex [24] and is<br />
considered briefly in later discussion. . The mid-point<br />
potentials E m , where E m ¼ Ep<br />
red þ Ep<br />
ox 2, and Ep<br />
red and<br />
Ep<br />
ox are reduction and oxidation peak potentials, for Cu–,<br />
Co–, and Ni-TCNQ systems under conditions employed<br />
in Fig. 1 are 0.11, 0.14, and 0.08 V vs Ag/AgCl, respectively.<br />
In the case <strong>of</strong> the CuTCNQ system, the reductive<br />
process presumably is <strong>associated</strong> <strong>with</strong> both the reduction <strong>of</strong><br />
TCNQ to TCNQ·− and Cu 2+ to Cu + followed by insertion <strong>of</strong><br />
Cu + to yield initially, phase I CuTCNQ, while the oxidative<br />
component is attributed to the overall reaction CuTCNQ →<br />
Cu 2+ + TCNQ + 2e − . On further cycling <strong>of</strong> the potential,<br />
the magnitude <strong>of</strong> the peak currents increase and formation<br />
<strong>of</strong> thermodynamically favored phase II CuTCNQ starts to<br />
be detected (Fig. 2) [24]. After five cycles, the total charge<br />
<strong>associated</strong> <strong>with</strong> the reduction and oxidation processes are<br />
almost identical, which implies that under these conditions,<br />
Fig. 2 Cyclic voltammograms obtained at a TCNQ-modified gold<br />
slide electrode in contact <strong>with</strong> 0.1 M CuSO 4 cycles 5–50 are shown<br />
over the potential range 0.3 to −0.12 V at a scan rate <strong>of</strong> 20 mV s −1<br />
approximate chemical reversibility is achieved. The oxidation<br />
peak at around 0.22 V seen in initial cycles is<br />
<strong>associated</strong> <strong>with</strong> the kinetically favored phase I, while the<br />
peak that grows at 0.26 V upon extensive cycling <strong>of</strong> the<br />
potential is derived from the thermodynamically favored<br />
phase II [24]. Cyclic voltammograms at a gold slide<br />
electrode in contact <strong>with</strong> 0.1 M CuSO 4 , CoCl 2 , or NiCl 2<br />
solution exhibit analogous voltammetry (Fig. 1, only<br />
second cycles shown), albeit in the latter two cases, no<br />
phase <strong>changes</strong> occur upon repetitive cycling <strong>of</strong> the<br />
potential. The voltammetry on gold or ITO-coated slide<br />
electrodes (similar to gold but data not shown), as seen at<br />
conventional macro disk electrodes [32], display the<br />
characteristics <strong>of</strong> nucleation-growth mechanism for the<br />
solid–solid transformation processes.<br />
Continuous cycling over the potential range shown in<br />
Fig. 1 is unlikely to lead to the formation <strong>of</strong> large MTCNQ<br />
crystals, as their growth will be continuously disrupted by<br />
the sequence <strong>of</strong> ingress and egress <strong>of</strong> metal ions. Controlled<br />
potential reductive electrolysis <strong>of</strong> solid TCNQ, in contact<br />
<strong>with</strong> metal ions, is therefore more likely to achieve this<br />
outcome. In a typical experiment <strong>of</strong> the latter kind, the<br />
potential used for the reductive electrolysis before in situ<br />
<strong>AFM</strong> imaging was determined from examination <strong>of</strong> cyclic<br />
voltammograms obtained at a scan rate <strong>of</strong> 20 mV s −1<br />
(Fig. 1). Thus, bulk reductive electrolysis potentials for Cu,<br />
Co, Ni used in conjunction <strong>with</strong> <strong>AFM</strong> imaging were set at<br />
−0.12, −0.18, and −0.18 V, while for bulk oxidative<br />
electrolysis, the potentials chosen were 0.30, 0.30, and<br />
0.20 V, respectively.<br />
In situ <strong>AFM</strong> characterization <strong>of</strong> the formation <strong>of</strong> MTCNQ<br />
Fig. 1 Cyclic voltammograms (second cycle <strong>of</strong> potential) at a scan<br />
rate <strong>of</strong> 20 mV s −1 obtained from a drop-casted TCNQ gold slide<br />
modified electrode in contact <strong>with</strong> aqueous 0.1 M CuSO 4 (solid line),<br />
0.1 M CoCl 2 (dashed line), and 0.1 M NiCl 2 (dotted line) solution<br />
CuTCNQ<br />
Ideally, all <strong>AFM</strong> images would be obtained from the same<br />
well-shaped rhombic TCNQ crystals, to maintain all
742 J Solid State Electrochem (2008) 12:739–746<br />
parameters related to crystal dimension at constant values.<br />
However, in practice, on imaging a crystal, the <strong>AFM</strong> tip can<br />
modify the crystal surface morphology even when the<br />
tapping force is at the lowest possible level. Thus, each<br />
<strong>AFM</strong> image is derived from different, although similarly<br />
sized TCNQ crystals <strong>of</strong> about 50×50 μm 2 , which represents<br />
a significant fraction <strong>of</strong> the total TCNQ crystal<br />
population. Other crystals present on the surface are<br />
generally smaller in size and less uniform.<br />
In the case <strong>of</strong> CuTCNQ, a 20×20 μm 2 <strong>AFM</strong> image <strong>of</strong><br />
the top surface <strong>of</strong> an approximately 50×50 μm 2 crystal was<br />
collected initially at open circuit potential. Two further<br />
images were then captured after reductive electrolysis for 5<br />
and 10 min. Finally, images were taken after 2.5, 20.5, and<br />
50.5 cycles over the potential range.<br />
The <strong>AFM</strong> image in Fig. 3a reveals that pristine 50×<br />
50 μm 2 TCNQ crystals are relatively flat, <strong>with</strong> only a few<br />
nanometers <strong>of</strong> roughness detected. After 5 min <strong>of</strong> reductive<br />
electrolysis at constant potential (Fig. 3b), many small<br />
crystals appeared, <strong>with</strong> a few already developed into rodlike<br />
shapes expected for phase I CuTCNQ. After 10 min <strong>of</strong><br />
reductive electrolysis (Fig. 3c), the majority <strong>of</strong> the crystals<br />
exhibited the rod-like shape. There is a relatively homogeneous<br />
distribution, <strong>with</strong> an average length <strong>of</strong> 2.18±0.45 μm<br />
and average width <strong>of</strong> 370±37 nm, an average height <strong>of</strong> 100<br />
±23 nm, and an aspect ratio <strong>of</strong> about 5.9. The fact that the<br />
width is significantly larger than the height could be due to<br />
the rod-like crystals being partially buried in the TCNQ<br />
crystal. Details <strong>of</strong> <strong>AFM</strong> imaging experiments after potential<br />
cycling experiments are as follows. After 2.5 cycles <strong>of</strong> the<br />
potential [end potential is negative (−)), tiny crystals are<br />
detected on the surface at random locations (Fig. 3d). It is<br />
interesting to compare their <strong>AFM</strong> result <strong>with</strong> information<br />
derived from cyclic voltammetry (Fig. 4). In the first 2.5<br />
cycles <strong>of</strong> potential, the voltammetric signal <strong>changes</strong><br />
dramatically, while the morphology as deduced from the<br />
<strong>AFM</strong> images <strong>of</strong> large crystal surfaces <strong>changes</strong> only slightly<br />
(Fig. 3d). However, voltammetric data reflects an average<br />
change <strong>associated</strong> <strong>with</strong> all crystals on the surface that<br />
include more rapidly reduced smaller crystals, while <strong>AFM</strong><br />
images only represent a specific region on a large 50×<br />
50 μm 2 crystals. Consequently, <strong>AFM</strong> images were obtained<br />
from at least five experiments and also on five different<br />
crystals to ensure that the images shown in Fig. 4 represent<br />
typical crystal morphology.<br />
After 20.5 cycles <strong>of</strong> the potential, Phase I CuTCNQ<br />
should be dominant, but <strong>with</strong> phase II detectable according<br />
to voltammetric data (Fig. 2). The <strong>AFM</strong> image obtained on<br />
a large crystal (Fig. 3e) is consistent <strong>with</strong> the electrochemical<br />
data. Thus, most <strong>of</strong> the crystals on the surface are rodlike,<br />
which is the characteristic morphology <strong>associated</strong> <strong>with</strong><br />
phase I CuTCNQ [24], although several rhombus-like<br />
crystals appear in the bottom-right part <strong>of</strong> the image. After<br />
50.5 cycles, the majority <strong>of</strong> the CuTCNQ crystals should be<br />
phase II, as deduced from cyclic voltammetric data (Fig. 2).<br />
The <strong>AFM</strong> image (Fig. 3f) supports this conclusion.<br />
Different-sized rhombus-like crystals now cover much <strong>of</strong><br />
the surface. A mechanism for this phase change induced by<br />
Fig. 3 <strong>AFM</strong> images, 20×20 μm 2 , showing the formation <strong>of</strong><br />
CuTCNQ from approximately 50×50 μm 2 TCNQ crystals adhered<br />
to an ITO electrode in contact <strong>with</strong> aqueous 0.1 M CuSO 4 solution. a<br />
a pristine TCNQ crystal at open circuit potential; b after reductive<br />
electrolysis at −0.12 V for 5 min; c after reductive electrolysis at<br />
−0.12 V for 10 min; d after 2.5 cycles <strong>of</strong> the potential; e after 20.5<br />
cycles <strong>of</strong> potential; f after 50.5 cycles <strong>of</strong> potential. The scan size for all<br />
the images is 20 μm
J Solid State Electrochem (2008) 12:739–746 743<br />
Fig. 4 Cyclic voltammogram obtained when a drop-casted TCNQ<br />
crystal modified gold slide electrode is in contact <strong>with</strong> aqueous 0.1 M<br />
CuSO 4 solution. The potential range is 0.3 to −0.12 V, and the scan<br />
rate is 20 mV s −1 . First cycle (solid line), second cycle (dashed line);<br />
2.5 cycles (dotted line)<br />
exhaustive cycling <strong>of</strong> the potential has been presented<br />
previously by Neufeld et al. [24].<br />
To confirm the effect <strong>of</strong> the potential cycling rather than<br />
time in determining the morphology after CuTCNQ Phase I<br />
was formed, the sample was left in solution overnight, and<br />
a new <strong>AFM</strong> observation was made. No change in the <strong>AFM</strong><br />
image was identified.<br />
Co[TCNQ] 2 (H 2 O) 2<br />
The procedure adopted to obtain <strong>AFM</strong> images <strong>of</strong> the TCNQ<br />
to Co[TCNQ] 2 (H 2 O) 2 transformation was the same as<br />
discussed for formation <strong>of</strong> CuTCNQ. However, in this<br />
case, it was not easy to obtain good quality images from the<br />
first few cycles <strong>of</strong> the potential. The reason for this is<br />
thought to be related to <strong>AFM</strong> imaging problems encountered<br />
from the presence <strong>of</strong> initially generated small Co<br />
[TCNQ] 2 (H 2 O) 2 rod-shaped nucleus crystals protruding<br />
outwards from the surface. Nevertheless, after reductive<br />
electrolysis for 5 min (Fig. 5a), good quality images<br />
were obtained, which revealed a predominance <strong>of</strong> evenly<br />
dispersed rod-like shaped crystals <strong>with</strong> a horizontal alignment.<br />
The size distribution <strong>of</strong> the crystals as deduced from<br />
several experiments on 50×50 μm 2 TCNQ crystals was<br />
found to be relatively narrow, having a characteristic length<br />
<strong>of</strong> 1.55±0.30 μm, height <strong>of</strong> 130±33 nm, and width <strong>of</strong> 300<br />
±28 nm, and an aspect ratio <strong>of</strong> about 5.2.<br />
It is also informative to probe the morphology under<br />
oxidative electrolysis conditions where metal ions should<br />
be removed from the lattice. In principle, reductive<br />
electrolysis for 5 min, followed by oxidative electrolysis<br />
for 10 min should ensure that all the cobalt ions are<br />
removed. However, almost 20% <strong>of</strong> the crystals retain their<br />
rod-like structures (Fig. 5b). It is likely that the rods<br />
detected in Fig. 5b remain as Co[TCNQ] 2 (H 2 O) 2 because<br />
they have become electrochemically disconnected from the<br />
electrode surface. Even longer electrolysis times or change<br />
<strong>of</strong> the substrate from ITO to gold, still leads to detection <strong>of</strong><br />
residual Co[TCNQ] 2 (H 2 O) 2 . Thus, the Co[TCNQ] 2 (H 2 O) 2 /<br />
TCNQ process is not fully reversible under these bulk<br />
electrolysis conditions. Raman spectroscopic evidence<br />
(described later) also supports this conclusion. In contrast,<br />
if adherence <strong>of</strong> TCNQ by the method referred to as<br />
mechanical attachment is employed [25], the process seems<br />
to be essentially exhaustive in both reduction and oxidation<br />
directions, and are hence, fully reversible [25]. In the<br />
mechanical attachment method, the TCNQ crystals are<br />
fragmented into tiny crystals (typically several microns in<br />
size) before being adhered to the electrode surface,<br />
resulting in a structure that is more akin to a film rather<br />
than an array <strong>of</strong> large crystals on the surface. This thin filmlike<br />
configuration enables more rapid ingress and egress <strong>of</strong><br />
ions from the structure, and consequently, behavior is closer<br />
to exhaustive bulk electrolysis in both directions.<br />
Ex situ SEM images obtained after reductive electrolysis<br />
<strong>of</strong> a TCNQ-modified ITO electrode in contact <strong>with</strong> 0.1 M<br />
Co(NO 3 ) 2 .6H 2 O aqueous solution at −0.05 V for 10 min<br />
also revealed the formation <strong>of</strong> a Co[TCNQ] 2 (H 2 O) 2<br />
network <strong>of</strong> nanorods (Fig. 6a). The close relationship to<br />
in situ <strong>AFM</strong> images implies that removal <strong>of</strong> the solvent<br />
environment required to obtain SEM images does not alter<br />
the morphology. SEM images therefore may be used to<br />
support <strong>AFM</strong> evidence that the overall rhombus shape <strong>of</strong><br />
Fig. 5 <strong>AFM</strong> images <strong>of</strong> Co<br />
[TCNQ] 2 (H 2 O) 2 crystals<br />
formed by reduction <strong>of</strong> 50×<br />
50 μm 2 TCNQ crystals which<br />
have been adhered to an ITO<br />
electrode in contact <strong>with</strong><br />
aqueous 0.1 M CoCl 2 solution:<br />
a after reductive electrolysis at<br />
−0.18 V for 5 min, b as for<br />
(a) followed by oxidative electrolysis<br />
at 0.30 V for 10 min
744 J Solid State Electrochem (2008) 12:739–746<br />
Fig. 6 a SEM image <strong>of</strong> the top<br />
face <strong>of</strong> a drop cast TCNQ<br />
crystal when Co[TCNQ] 2 (H 2 O) 2<br />
is formed by reductive electrolysis<br />
<strong>of</strong> a TCNQ modified ITO<br />
electrode for 10 min at −0.05 V<br />
in the presence <strong>of</strong> aqueous<br />
0.1 M Co(NO 3 ) 2 solution.<br />
b–d SEM images obtained <strong>of</strong><br />
the bottom face <strong>of</strong> the crystal<br />
when Co[TCNQ] 2 (H 2 O) 2 is<br />
formed under the same conditions<br />
as for (a)<br />
the parent TCNQ crystal structure remains intact after<br />
formation <strong>of</strong> Co[TCNQ] 2 (H 2 O) 2 , and also that after<br />
extensive reduction, Co[TCNQ] 2 (H 2 O) 2 nanorods almost<br />
completely cover both the edges and top <strong>of</strong> the large parent<br />
precursor TCNQ crystal. This outcome addressed a fundamental<br />
question concerning the nature and location <strong>of</strong> the<br />
initial nucleation/growth sites <strong>associated</strong> <strong>with</strong> the solid–<br />
solid electrochemically induced TCNQ/Co[TCNQ] 2 (H 2 O) 2<br />
transformation process. From an energetic point <strong>of</strong> view,<br />
the triple phase solid∣electrode∣electrolyte junction should<br />
provide the location for the initial nucleation sites [33–36].<br />
Presumably, growth would commence from the bottom<br />
edge <strong>of</strong> the TCNQ crystal, <strong>with</strong> the fastest rate being along<br />
the edge surfaces rather than through the center <strong>of</strong> the<br />
TCNQ crystal. This “network” type nucleation-growth<br />
process would be facilitated by the semiconducting nature<br />
<strong>of</strong> Co[TCNQ] 2 (H 2 O) 2 . Thus, the area <strong>of</strong> the electrode<br />
surface effectively increases as crystal growth extends.<br />
Presumably, the rate <strong>of</strong> growth into the interior <strong>of</strong> TCNQ<br />
crystals may be restricted by Ohmic drop (iR u , i=current,<br />
R u =uncompensated resistance) considerations and lack <strong>of</strong><br />
ready access to Co 2þ ðaqÞ ions.<br />
To gain additional insight into the location <strong>of</strong> the initial<br />
nucleation and growth stage, we repeated the reductive<br />
electrolysis experiments, but now examined SEM images<br />
derived from the bottom face <strong>of</strong> the TCNQ crystal. Thus,<br />
after 10 min electrolysis in the presence <strong>of</strong> Co 2þ ðaqÞ<br />
electrolyte, the top face <strong>of</strong> the Co[TCNQ] 2 (H 2 O) 2 -modified<br />
ITO electrode was pressed onto a carbon tape, and the<br />
adhered solid was removed from the ITO surface. Using<br />
this method, ex situ SEM images <strong>of</strong> the solid that had been<br />
in direct contact <strong>with</strong> the electrode surface could be<br />
obtained, i.e., the bottom face <strong>of</strong> the TCNQ crystals.<br />
Inspection <strong>of</strong> the images (Fig. 6b–d) revealed that the bases<br />
<strong>of</strong> the large rhombic-shaped TCNQ crystals have become<br />
completely covered <strong>with</strong> needle-shaped Co[TCNQ] 2 (H 2 O) 2<br />
Fig. 7 <strong>AFM</strong> images <strong>of</strong> Ni<br />
[TCNQ] 2 (H 2 O) 2 crystals<br />
formed by reduction <strong>of</strong> 50×<br />
50 μm 2 TCNQ crystals adhered<br />
to an ITO electrode in contact<br />
<strong>with</strong> aqueous 0.1 M NiCl 2 solution.<br />
a after reductive electrolysis<br />
at −0.18 V for 5 min. b<br />
image <strong>of</strong> (a) obtained at higher<br />
magnification
J Solid State Electrochem (2008) 12:739–746 745<br />
Fig. 8 Raman spectra obtained for a TCNQ adhered to a gold slide<br />
electrode before reductive electrolysis; b, c, and d MTCNQ formed by<br />
reductive electrolysis for 10 min when TCNQ is adhered to a gold<br />
slide electrode in contact <strong>with</strong> aqueous 0.1 M CuSO 4 (b), 0.1 M<br />
CoCl 2 (c), 0.1 M NiCl 2 (d); e Spectrum produced by oxidative<br />
electrolysis <strong>of</strong> Ni[TCNQ] 2 (H 2 O) 2 formed in (d)<br />
crystals having a length <strong>of</strong> ∼2 μm and a width <strong>of</strong> ∼100–<br />
200 nm. This observation supports the hypothesis that the<br />
initial nucleation sites occur at locations where direct<br />
contact between electrode surface, electrolyte and solid<br />
TCNQ occurs. Presumably, ingress <strong>of</strong> Co 2þ ðaqÞ may occur<br />
below the bottom face <strong>of</strong> the TCNQ surface because neither<br />
the TCNQ solid nor electrode surface are fully flat, thereby<br />
allowing aqueous electrolyte to penetrate between these two<br />
regions.<br />
Ni[TCNQ] 2 (H 2 O) 2<br />
Ni[TCNQ] 2 (H 2 O) 2 is formed by solid–solid conversion <strong>of</strong><br />
TCNQ (Eq. 3) in an analogous manner to that for Co<br />
[TCNQ] 2 (H 2 O) 2 . Ni[TCNQ] 2 (H 2 O) 2 also exists in only one<br />
phase as rod-like crystals. However, Ni[TCNQ] 2 (H 2 O) 2<br />
forms much smaller crystals than Co[TCNQ] 2 (H 2 O) 2 <strong>with</strong> a<br />
preferential orientation into the bulk solution. Fig. 7<br />
contains <strong>AFM</strong> images after reductive electrolysis for<br />
5 min at different magnifications. Typically, the numerous<br />
tiny Ni[TCNQ] 2 (H 2 O) 2 rods protrude from the substrate.<br />
The typical size detected under conditions <strong>of</strong> Fig. 7 is<br />
300 nm in length and 80 nm in width. In contrast, the<br />
dominant feature in images <strong>of</strong> Co[TCNQ] 2 (H 2 O) 2 were<br />
horizontally oriented and were much longer rods <strong>of</strong> 1.5 μm<br />
in length and 300 nm wide.<br />
Raman spectroscopic characterization <strong>of</strong> solid–solid<br />
electrochemical conversion<br />
Raman spectra [37–40] obtained in the ex situ mode allow a<br />
ready distinction between TCNQ and [TCNQ] .− -containing<br />
compounds, and hence, allow the course <strong>of</strong> reduction and<br />
oxidation on the surface <strong>of</strong> 50×50 μm 2 crystals to be<br />
monitored. Thus, upon solid–solid transformation <strong>of</strong> TCNQ<br />
into MTCNQ, it is expected that the frequency <strong>of</strong> the<br />
1,454 cm −1 C–CN stretch in TCNQ (Fig. 8a) would shift to<br />
about 1,380 cm −1 if [TCNQ] .− is formed. In addition, the<br />
2,225 cm −1 C≡N stretching band (Fig. 8a) in TCNQ shoud<br />
shift to a lower wavelength upon reduction, and the total<br />
Raman intensity should drop significantly due to the higher<br />
absorbance <strong>of</strong> MTCNQ and concomitant decrease in the<br />
scattering volume [37–40].<br />
In the case <strong>of</strong> electrochemical formation <strong>of</strong> CuTCNQ<br />
and Co[TCNQ] 2 (H 2 O) 2 (see Fig. 8b,c) by reductive<br />
electrolysis <strong>of</strong> TCNQ for 10 min, ex situ detection <strong>of</strong><br />
Raman bands at 1,383 and 1,390 cm −1 , respectively is<br />
indicative <strong>of</strong> [TCNQ] .− formation. However, retention <strong>of</strong><br />
the band at 1,454 cm −1 indicates that residual TCNQ also is<br />
still present. The TCNQ band at 2,226 cm −1 shifts only<br />
slightly to around 2,220 cm −1 . Thus, according to Raman<br />
spectra evidence, the majority <strong>of</strong> the 50×50 μm 2 TCNQ<br />
surface has been changed to M + [TCNQ] .− , but some TCNQ<br />
remains. The laser detection spot used in Raman spectroscopy<br />
can penetrate to a depth <strong>of</strong> several microns. Thus,<br />
residual TCNQ, which is detected, may not lie on the<br />
surface. For Ni[TCNQ] 2 (H 2 O) 2 , the transformation is<br />
quantitative <strong>with</strong> respect to Raman spectroscopic evidence<br />
(Fig. 8d). In this case, the 1,454 cm −1 band fully disappeared<br />
upon reduction, while the 2,225 cm −1 band shifted<br />
to 2,209 cm −1 . It is plausible that this is <strong>associated</strong> <strong>with</strong> the<br />
much smaller Ni[TCNQ] 2 (H 2 O) 2 crystal size and their<br />
prevailing direction into the solution phase. Ex situ Raman<br />
spectra (Fig. 8e) shows that after applying a potential<br />
required to transform Ni[TCNQ] 2 (H 2 O) 2 back to TCNQ,<br />
the 2,209 cm −1 resonance reverts back to 2,224 cm −1 ,as<br />
expected if MTCNQ is transformed back to TCNQ <strong>with</strong><br />
egress <strong>of</strong> the Ni 2+ ions. However, the 1,377-cm −1 resonance<br />
remains detectable, although significantly lower in intensity.<br />
A similar situation prevails for the other TCNQ/<br />
MTCNQ processes. These data, in agreement <strong>with</strong> conclusions<br />
reached by in situ <strong>AFM</strong> morphology data, suggest<br />
that while most <strong>of</strong> the solid MTCNQ can be electrochemically<br />
converted back to TCNQ, residual amounts remain<br />
even when the potential is held at sufficiently positive<br />
potential for long periods <strong>of</strong> time.<br />
Conclusions<br />
In situ <strong>AFM</strong> images <strong>of</strong> the electrochemically induced solid–<br />
solid TCNQ/MTCNQ transformation provides insights into<br />
the nucleation growth process that allow redox interconversion<br />
<strong>of</strong> the two solids. By controlling the time <strong>of</strong><br />
reductive electrolysis, nearly mono-dispersed rod-like
746 J Solid State Electrochem (2008) 12:739–746<br />
MTCNQ can be obtained on the face and side <strong>of</strong> original<br />
relatively flat rhombic-shaped 50×50 μm 2 TCNQ crystals.<br />
Ex situ SEM imaging <strong>of</strong> the underside <strong>of</strong> the crystals also<br />
reveals that the nucleation-growth process takes place<br />
where the electrode is in direct contact <strong>with</strong> TCNQ and<br />
presumably also <strong>with</strong> electrolyte. For CuTCNQ, the<br />
morphology change connected <strong>with</strong> phase I to phase II<br />
transformation that occurs under conditions <strong>of</strong> cyclic<br />
voltammetry also can be detected. During the process <strong>of</strong><br />
crystal solid–solid state transformation, the initial nucleation<br />
site is likely to be the solid∣electrode∣electrolyte<br />
junction, <strong>with</strong> growth favored along the surface <strong>of</strong> the<br />
crystal. Significant differences in morphology are <strong>associated</strong><br />
<strong>with</strong> each TCNQ/MTCNQ transformation. Raman<br />
spectra and <strong>AFM</strong> images suggest that 100% interconversion<br />
is not always achieved even after extensive electrolysis<br />
<strong>of</strong> large 50×50 μm 2 -sized TCNQ crystals.<br />
Acknowledgment The Australian Research Council is gratefully<br />
acknowledged for financial support <strong>of</strong> this project.<br />
References<br />
1. Acker DS et al (1960) J Am Chem Soc 82:6408–6409<br />
2. Krysinski P, Tien HT (1988) Bioelectrochem and Bioenerg<br />
19:227–233<br />
3. Freund MS, Brajtertoth A, Ward MD (1990) J Electroanal Chem<br />
289:127–141<br />
4. Nakajima K, Kageshima M, Ara N, Yoshimura M, Kawazu A<br />
(1993) Appl Phys Lett 62:1892–1894<br />
5. Bond AM, Fletcher S, Marken F, Shaw SJ, Symons PG (1996) J<br />
Chem Soc-Faraday Trans 92:3925–3933<br />
6. Chambers JQ, Scaboo K, Evans CD (1996) J Electrochem Soc<br />
143:3039–3045<br />
7. Bartlett PN, Tong XQ (1997) J Phys Chem B 101:8540–8549<br />
8. Bond AM, Fiedler DA (1997) J Electrochem Soc 144:1566–1574<br />
9. Bond AM, Fletcher S, Symons PG (1998) Analyst 123:1891–1904<br />
10. Oyama M et al (1998) J Phys Chem B 102:6588–6595<br />
11. Bellec V et al (2001) Electrochem Comm 3:483–488<br />
12. Fraxedas J, Langer J, Diez I, Sanz F (2006) J Low Temp Phys<br />
142:121–126<br />
13. Gomez L, Rodriguez-Amaro R (2006) Langmuir 22:7431–7436<br />
14. Liu YL et al (2006) J Am Chem Soc 128:12917–12922<br />
15. O’Mullane AP, Neufeld AK, Bond AM (2005) Anal Chem<br />
77:5447–5452<br />
16. Neufeld AK, O’Mullane AP, Bond AM (2005) J Am Chem Soc<br />
127:13846–13853<br />
17. Harris AR, Neufeld AK, O’Mullane AP, Bond AM, Morrison RJS<br />
(2005) J Electrochem Soc 152:C577–C583<br />
18. Cao GY et al (2005) Micron 36:267–270<br />
19. Zhang Q, Kong LZ, Zhang QJ, Wang WJ, Hua ZY (2004) Solid<br />
State Commun 130:799–802<br />
20. Liu SG, Liu YQ, Wu PJ, Zhu DB (1996) Chem Mater 8:2779–<br />
2787<br />
21. Heintz RA et al (1999) Inorg Chem 38:144–156<br />
22. Liu YL et al (2005) Adv Mater 17:2953–2957<br />
23. Potember RS, Poehler TO, Cowan DO, Bloch AN (1981) Bull<br />
Amer Phys Soc 26:309<br />
24. Neufeld AK, Madsen I, Bond AM, Hogan CF (2003) Chem Mater<br />
15:3573–3585<br />
25. Nafady A, O’Mullane AP, Bond AM, Neufeld AK (2006) Chem<br />
Mater 18:4375–4384<br />
26. Hoagland JJ, Wang XD, Hipps KW (1993) Chem Mater 5:54–60<br />
27. Wan LJ, Itaya K (2001) Chin Sci Bull 46:377–380<br />
28. Magonov SN, Bar G, Cantow HJ, Ren J, Whangbo MH (1994)<br />
Synth Met 62:159–167<br />
29. Higo M, Lu X, Mazur U, Hipps KW (2001) Thin Solid Films<br />
384:90–101<br />
30. Suarez MF, Bond AM, Compton RG (1999) J Solid State<br />
Electrochem 4:24–33<br />
31. Bond AM (2002) Broadening electrochemical horizons: principles<br />
and illustration <strong>of</strong> voltammetric and related techniques, Chapter 5.<br />
Oxford University Press, Oxford<br />
32. Nafady A, Bond AM (2007) Inorg Chem 46:4128–4137<br />
33. Bak E, Donten M, Stojek Z, Scholz F (2007) Electrochem Comm<br />
9:386–392<br />
34. Deng Y et al (2005) J Phys Chem B 109:14043–14051<br />
35. Hasse U, Scholz F (2001) Electrochem Comm 3:429–434<br />
36. Hermes M, Scholz F (2000) Electrochem Comm 2:845–850<br />
37. Suchanski MR, Vanduyne RP (1976) J Am Chem Soc 98:250–<br />
252<br />
38. Hu ZP et al (1995) J Mol Struct 356:163–168<br />
39. Makowski M, Pawlikowski MT (2006) Int J Quantum Chem<br />
106:1736–1748<br />
40. Gucciardi PG, Trusso S, Vasi C, Patane S, Allegrini M (2002)<br />
Phys Chem Chem Phys 4:2747–2753