AFM study of morphological changes associated with ...
AFM study of morphological changes associated with ...
AFM study of morphological changes associated with ...

You also want an ePaper? Increase the reach of your titles
YUMPU automatically turns print PDFs into web optimized ePapers that Google loves.
740 J Solid State Electrochem (2008) 12:739–746<br />
NC<br />
NC<br />
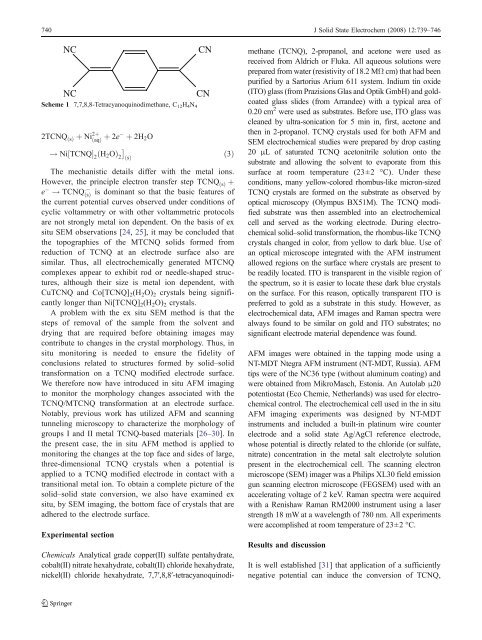
Scheme 1 7,7,8,8-Tetracyanoquinodimethane, C 12 H 4 N 4<br />
2TCNQ ðÞ s þ Ni 2þ ðaqÞ þ 2e þ 2H 2O<br />
<br />
! Ni½TCNQŠ 2<br />
ðH 2 OÞ 2<br />
ðÞ s<br />
ð3Þ<br />
The mechanistic details differ <strong>with</strong> the metal ions.<br />
However, the principle electron transfer step TCNQ ðÞ s þ<br />
e ! TCNQ : ðÞ s is dominant so that the basic features <strong>of</strong><br />
the current potential curves observed under conditions <strong>of</strong><br />
cyclic voltammetry or <strong>with</strong> other voltammetric protocols<br />
are not strongly metal ion dependent. On the basis <strong>of</strong> ex<br />
situ SEM observations [24, 25], it may be concluded that<br />
the topographies <strong>of</strong> the MTCNQ solids formed from<br />
reduction <strong>of</strong> TCNQ at an electrode surface also are<br />
similar. Thus, all electrochemically generated MTCNQ<br />
complexes appear to exhibit rod or needle-shaped structures,<br />
although their size is metal ion dependent, <strong>with</strong><br />
CuTCNQ and Co[TCNQ] 2 (H 2 O) 2 crystals being significantly<br />
longer than Ni[TCNQ] 2 (H 2 O) 2 crystals.<br />
A problem <strong>with</strong> the ex situ SEM method is that the<br />
steps <strong>of</strong> removal <strong>of</strong> the sample from the solvent and<br />
drying that are required before obtaining images may<br />
contribute to <strong>changes</strong> in the crystal morphology. Thus, in<br />
situ monitoring is needed to ensure the fidelity <strong>of</strong><br />
conclusions related to structures formed by solid–solid<br />
transformation on a TCNQ modified electrode surface.<br />
We therefore now have introduced in situ <strong>AFM</strong> imaging<br />
to monitor the morphology <strong>changes</strong> <strong>associated</strong> <strong>with</strong> the<br />
TCNQ/MTCNQ transformation at an electrode surface.<br />
Notably, previous work has utilized <strong>AFM</strong> and scanning<br />
tunneling microscopy to characterize the morphology <strong>of</strong><br />
groups I and II metal TCNQ-based materials [26–30]. In<br />
the present case, the in situ <strong>AFM</strong> method is applied to<br />
monitoring the <strong>changes</strong> at the top face and sides <strong>of</strong> large,<br />
three-dimensional TCNQ crystals when a potential is<br />
applied to a TCNQ modified electrode in contact <strong>with</strong> a<br />
transitional metal ion. To obtain a complete picture <strong>of</strong> the<br />
solid–solid state conversion, we also have examined ex<br />
situ, by SEM imaging, the bottom face <strong>of</strong> crystals that are<br />
adhered to the electrode surface.<br />
Experimental section<br />
CN<br />
CN<br />
Chemicals Analytical grade copper(II) sulfate pentahydrate,<br />
cobalt(II) nitrate hexahydrate, cobalt(II) chloride hexahydrate,<br />
nickel(II) chloride hexahydrate, 7,7′,8,8′-tetracyanoquinodimethane<br />
(TCNQ), 2-propanol, and acetone were used as<br />
received from Aldrich or Fluka. All aqueous solutions were<br />
prepared from water (resistivity <strong>of</strong> 18.2 MΩ cm) that had been<br />
purified by a Sartorius Arium 611 system. Indium tin oxide<br />
(ITO) glass (from Prazisions Glas and Optik GmbH) and goldcoated<br />
glass slides (from Arrandee) <strong>with</strong> a typical area <strong>of</strong><br />
0.20 cm 2 were used as substrates. Before use, ITO glass was<br />
cleaned by ultra-sonication for 5 min in, first, acetone and<br />
then in 2-propanol. TCNQ crystals used for both <strong>AFM</strong> and<br />
SEM electrochemical studies were prepared by drop casting<br />
20 μL <strong>of</strong> saturated TCNQ acetonitrile solution onto the<br />
substrate and allowing the solvent to evaporate from this<br />
surface at room temperature (23±2 °C). Under these<br />
conditions, many yellow-colored rhombus-like micron-sized<br />
TCNQ crystals are formed on the substrate as observed by<br />
optical microscopy (Olympus BX51M). The TCNQ modified<br />
substrate was then assembled into an electrochemical<br />
cell and served as the working electrode. During electrochemical<br />
solid–solid transformation, the rhombus-like TCNQ<br />
crystals changed in color, from yellow to dark blue. Use <strong>of</strong><br />
an optical microscope integrated <strong>with</strong> the <strong>AFM</strong> instrument<br />
allowed regions on the surface where crystals are present to<br />
be readily located. ITO is transparent in the visible region <strong>of</strong><br />
the spectrum, so it is easier to locate these dark blue crystals<br />
on the surface. For this reason, optically transparent ITO is<br />
preferred to gold as a substrate in this <strong>study</strong>. However, as<br />
electrochemical data, <strong>AFM</strong> images and Raman spectra were<br />
always found to be similar on gold and ITO substrates; no<br />
significant electrode material dependence was found.<br />
<strong>AFM</strong> images were obtained in the tapping mode using a<br />
NT-MDT Ntegra <strong>AFM</strong> instrument (NT-MDT, Russia). <strong>AFM</strong><br />
tips were <strong>of</strong> the NC36 type (<strong>with</strong>out aluminum coating) and<br />
were obtained from MikroMasch, Estonia. An Autolab μ20<br />
potentiostat (Eco Chemie, Netherlands) was used for electrochemical<br />
control. The electrochemical cell used in the in situ<br />
<strong>AFM</strong> imaging experiments was designed by NT-MDT<br />
instruments and included a built-in platinum wire counter<br />
electrode and a solid state Ag/AgCl reference electrode,<br />
whose potential is directly related to the chloride (or sulfate,<br />
nitrate) concentration in the metal salt electrolyte solution<br />
present in the electrochemical cell. The scanning electron<br />
microscope (SEM) imager was a Philips XL30 field emission<br />
gun scanning electron microscope (FEGSEM) used <strong>with</strong> an<br />
accelerating voltage <strong>of</strong> 2 keV. Raman spectra were acquired<br />
<strong>with</strong> a Renishaw Raman RM2000 instrument using a laser<br />
strength 18 mW at a wavelength <strong>of</strong> 780 nm. All experiments<br />
were accomplished at room temperature <strong>of</strong> 23±2 °C.<br />
Results and discussion<br />
It is well established [31] that application <strong>of</strong> a sufficiently<br />
negative potential can induce the conversion <strong>of</strong> TCNQ,