AFM study of morphological changes associated with ...
AFM study of morphological changes associated with ...
AFM study of morphological changes associated with ...

Create successful ePaper yourself
Turn your PDF publications into a flip-book with our unique Google optimized e-Paper software.
J Solid State Electrochem (2008) 12:739–746 741<br />
adhered on an electrode surface, to MTCNQ, in the<br />
presence <strong>of</strong> M xþ<br />
ðaqÞ<br />
. When the chemically modified electrode<br />
is in contact <strong>with</strong> the relevant metal salt solutions<br />
[16, 24, 25, 32] (M=Cu 2+ ,Co 2+ ,Ni 2+ ), electrochemically<br />
induced transformation <strong>of</strong> TCNQ to Co[TCNQ] 2 (H 2 O) 2<br />
and Ni[TCNQ] 2 (H 2 O) 2 occurs in a single step under<br />
voltammetric conditions [25, 32]. Formation <strong>of</strong> CuTCNQ<br />
represents a more complicated case because TCNQ is<br />
initially transformed to highly conductive and kinetically<br />
favored phase I CuTCNQ (rod or needle shaped crystals)<br />
and subsequently under conditions <strong>of</strong> cyclic voltammetry to<br />
less conductive, but thermodynamically stable, phase II<br />
CuTCNQ (rhombus-shaped crystals) [24].<br />
Cyclic voltammetry<br />
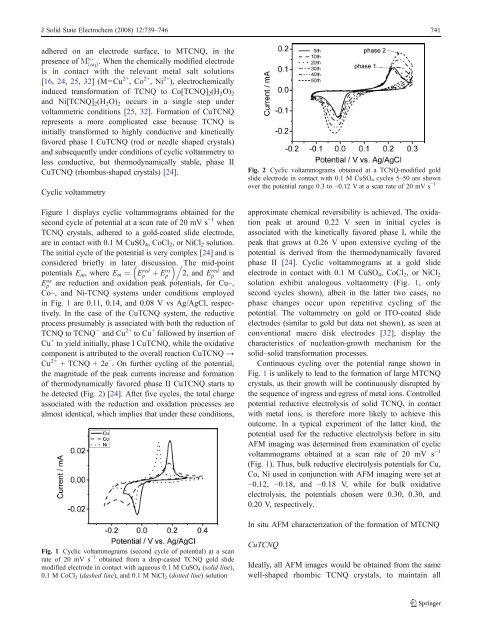
Figure 1 displays cyclic voltammograms obtained for the<br />
second cycle <strong>of</strong> potential at a scan rate <strong>of</strong> 20 mV s −1 when<br />
TCNQ crystals, adhered to a gold-coated slide electrode,<br />
are in contact <strong>with</strong> 0.1 M CuSO 4 , CoCl 2 , or NiCl 2 solution.<br />
The initial cycle <strong>of</strong> the potential is very complex [24] and is<br />
considered briefly in later discussion. . The mid-point<br />
potentials E m , where E m ¼ Ep<br />
red þ Ep<br />
ox 2, and Ep<br />
red and<br />
Ep<br />
ox are reduction and oxidation peak potentials, for Cu–,<br />
Co–, and Ni-TCNQ systems under conditions employed<br />
in Fig. 1 are 0.11, 0.14, and 0.08 V vs Ag/AgCl, respectively.<br />
In the case <strong>of</strong> the CuTCNQ system, the reductive<br />
process presumably is <strong>associated</strong> <strong>with</strong> both the reduction <strong>of</strong><br />
TCNQ to TCNQ·− and Cu 2+ to Cu + followed by insertion <strong>of</strong><br />
Cu + to yield initially, phase I CuTCNQ, while the oxidative<br />
component is attributed to the overall reaction CuTCNQ →<br />
Cu 2+ + TCNQ + 2e − . On further cycling <strong>of</strong> the potential,<br />
the magnitude <strong>of</strong> the peak currents increase and formation<br />
<strong>of</strong> thermodynamically favored phase II CuTCNQ starts to<br />
be detected (Fig. 2) [24]. After five cycles, the total charge<br />
<strong>associated</strong> <strong>with</strong> the reduction and oxidation processes are<br />
almost identical, which implies that under these conditions,<br />
Fig. 2 Cyclic voltammograms obtained at a TCNQ-modified gold<br />
slide electrode in contact <strong>with</strong> 0.1 M CuSO 4 cycles 5–50 are shown<br />
over the potential range 0.3 to −0.12 V at a scan rate <strong>of</strong> 20 mV s −1<br />
approximate chemical reversibility is achieved. The oxidation<br />
peak at around 0.22 V seen in initial cycles is<br />
<strong>associated</strong> <strong>with</strong> the kinetically favored phase I, while the<br />
peak that grows at 0.26 V upon extensive cycling <strong>of</strong> the<br />
potential is derived from the thermodynamically favored<br />
phase II [24]. Cyclic voltammograms at a gold slide<br />
electrode in contact <strong>with</strong> 0.1 M CuSO 4 , CoCl 2 , or NiCl 2<br />
solution exhibit analogous voltammetry (Fig. 1, only<br />
second cycles shown), albeit in the latter two cases, no<br />
phase <strong>changes</strong> occur upon repetitive cycling <strong>of</strong> the<br />
potential. The voltammetry on gold or ITO-coated slide<br />
electrodes (similar to gold but data not shown), as seen at<br />
conventional macro disk electrodes [32], display the<br />
characteristics <strong>of</strong> nucleation-growth mechanism for the<br />
solid–solid transformation processes.<br />
Continuous cycling over the potential range shown in<br />
Fig. 1 is unlikely to lead to the formation <strong>of</strong> large MTCNQ<br />
crystals, as their growth will be continuously disrupted by<br />
the sequence <strong>of</strong> ingress and egress <strong>of</strong> metal ions. Controlled<br />
potential reductive electrolysis <strong>of</strong> solid TCNQ, in contact<br />
<strong>with</strong> metal ions, is therefore more likely to achieve this<br />
outcome. In a typical experiment <strong>of</strong> the latter kind, the<br />
potential used for the reductive electrolysis before in situ<br />
<strong>AFM</strong> imaging was determined from examination <strong>of</strong> cyclic<br />
voltammograms obtained at a scan rate <strong>of</strong> 20 mV s −1<br />
(Fig. 1). Thus, bulk reductive electrolysis potentials for Cu,<br />
Co, Ni used in conjunction <strong>with</strong> <strong>AFM</strong> imaging were set at<br />
−0.12, −0.18, and −0.18 V, while for bulk oxidative<br />
electrolysis, the potentials chosen were 0.30, 0.30, and<br />
0.20 V, respectively.<br />
In situ <strong>AFM</strong> characterization <strong>of</strong> the formation <strong>of</strong> MTCNQ<br />
Fig. 1 Cyclic voltammograms (second cycle <strong>of</strong> potential) at a scan<br />
rate <strong>of</strong> 20 mV s −1 obtained from a drop-casted TCNQ gold slide<br />
modified electrode in contact <strong>with</strong> aqueous 0.1 M CuSO 4 (solid line),<br />
0.1 M CoCl 2 (dashed line), and 0.1 M NiCl 2 (dotted line) solution<br />
CuTCNQ<br />
Ideally, all <strong>AFM</strong> images would be obtained from the same<br />
well-shaped rhombic TCNQ crystals, to maintain all