Uniform Mitigation Assessment Method TRAINING MANUAL
Uniform Mitigation Assessment Method TRAINING MANUAL
Uniform Mitigation Assessment Method TRAINING MANUAL

You also want an ePaper? Increase the reach of your titles
YUMPU automatically turns print PDFs into web optimized ePapers that Google loves.
Water Environment - 62-345.500(6)(b), FAC<br />
a. Water levels and flows (continued)<br />
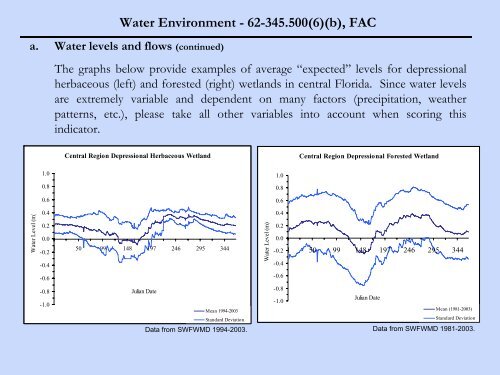
The graphs below provide examples of average “expected” levels for depressional<br />
herbaceous (left) and forested (right) wetlands in central Florida. Since water levels<br />
are extremely variable and dependent on many factors (precipitation, weather<br />
patterns, etc.), please take all other variables into account when scoring this<br />
indicator.<br />
Central Region Depressional Herbaceous Wetland<br />
Central Region Depressional Forested Wetland<br />
1.0<br />
1.0<br />
0.8<br />
0.8<br />
0.6<br />
0.6<br />
Water Level (m)<br />
0.4<br />
0.2<br />
0.0<br />
-0.2<br />
-0.4<br />
1 50 99 148 197 246 295 344<br />
Water Level (m) .<br />
0.4<br />
0.2<br />
0.0<br />
-0.2<br />
-0.4<br />
1 50 99 148 197 246 295 344<br />
-0.6<br />
-0.6<br />
-0.8<br />
-1.0<br />
Julian Date<br />
Mean 1994-2003<br />
Standard Deviation<br />
Data from SWFWMD 1994-2003.<br />
-0.8<br />
-1.0<br />
Julian Date<br />
Mean (1981-2003)<br />
Standard Deviation<br />
Data from SWFWMD 1981-2003.