zmap a tool for analyses of seismicity patterns typical applications ...
zmap a tool for analyses of seismicity patterns typical applications ...
zmap a tool for analyses of seismicity patterns typical applications ...

Create successful ePaper yourself
Turn your PDF publications into a flip-book with our unique Google optimized e-Paper software.
CHAPTER II<br />
Are there serious problems with heterogeneous reporting in a<br />
catalog? What is the starting time <strong>of</strong> the high-quality data?<br />
Work done already: We assume that you have acquainted yourself with the general<br />
properties <strong>of</strong> the catalog. You deleted the hypocenters outside the periphery <strong>of</strong> the<br />
network and those <strong>of</strong> erroneously large depth, as well as the M0, if they are meaningless,<br />
and the explosions. For this cases study, we use the <strong>seismicity</strong> on the San Andreas fault<br />
near Parkfield.<br />
Preliminary Declustering: If you want to evaluate whether or not the catalog contains<br />
rate changes that are best interpreted as artificial, it may be that aftershocks and swarms<br />
get in the way. If you feel that is the case, please decluster leaving all earthquakes with<br />
meaningful magnitudes in the data. The earthquakes smaller than Mc contain important<br />
in<strong>for</strong>mation on operational changes in the network.<br />
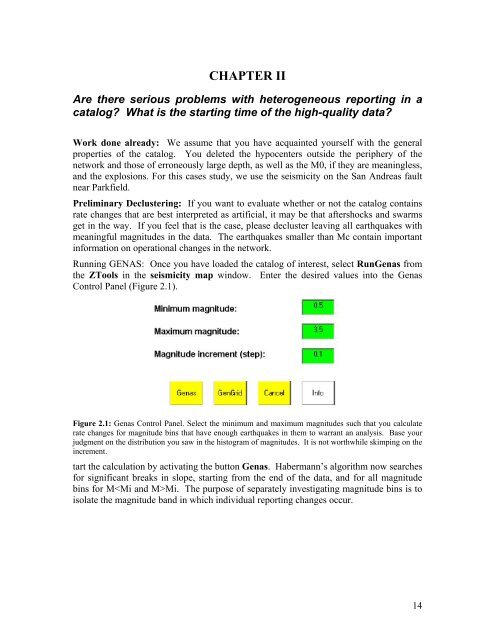
Running GENAS: Once you have loaded the catalog <strong>of</strong> interest, select RunGenas from<br />
the ZTools in the <strong>seismicity</strong> map window. Enter the desired values into the Genas<br />
Control Panel (Figure 2.1).<br />
Figure 2.1: Genas Control Panel. Select the minimum and maximum magnitudes such that you calculate<br />
rate changes <strong>for</strong> magnitude bins that have enough earthquakes in them to warrant an analysis. Base your<br />
judgment on the distribution you saw in the histogram <strong>of</strong> magnitudes. It is not worthwhile skimping on the<br />
increment.<br />
tart the calculation by activating the button Genas. Habermann’s algorithm now searches<br />
<strong>for</strong> significant breaks in slope, starting from the end <strong>of</strong> the data, and <strong>for</strong> all magnitude<br />
bins <strong>for</strong> MMi. The purpose <strong>of</strong> separately investigating magnitude bins is to<br />
isolate the magnitude band in which individual reporting changes occur.<br />
14