zmap a tool for analyses of seismicity patterns typical applications ...
zmap a tool for analyses of seismicity patterns typical applications ...
zmap a tool for analyses of seismicity patterns typical applications ...

Create successful ePaper yourself
Turn your PDF publications into a flip-book with our unique Google optimized e-Paper software.
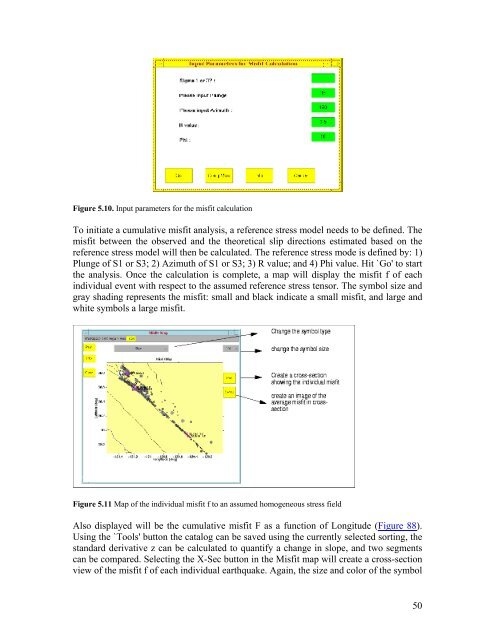
Figure 5.10. Input parameters <strong>for</strong> the misfit calculation<br />
To initiate a cumulative misfit analysis, a reference stress model needs to be defined. The<br />
misfit between the observed and the theoretical slip directions estimated based on the<br />
reference stress model will then be calculated. The reference stress mode is defined by: 1)<br />
Plunge <strong>of</strong> S1 or S3; 2) Azimuth <strong>of</strong> S1 or S3; 3) R value; and 4) Phi value. Hit `Go' to start<br />
the analysis. Once the calculation is complete, a map will display the misfit f <strong>of</strong> each<br />
individual event with respect to the assumed reference stress tensor. The symbol size and<br />
gray shading represents the misfit: small and black indicate a small misfit, and large and<br />
white symbols a large misfit.<br />
Figure 5.11 Map <strong>of</strong> the individual misfit f to an assumed homogeneous stress field<br />
Also displayed will be the cumulative misfit F as a function <strong>of</strong> Longitude (Figure 88).<br />
Using the `Tools' button the catalog can be saved using the currently selected sorting, the<br />
standard derivative z can be calculated to quantify a change in slope, and two segments<br />
can be compared. Selecting the X-Sec button in the Misfit map will create a cross-section<br />
view <strong>of</strong> the misfit f <strong>of</strong> each individual earthquake. Again, the size and color <strong>of</strong> the symbol<br />
50