zmap a tool for analyses of seismicity patterns typical applications ...
zmap a tool for analyses of seismicity patterns typical applications ...
zmap a tool for analyses of seismicity patterns typical applications ...

You also want an ePaper? Increase the reach of your titles
YUMPU automatically turns print PDFs into web optimized ePapers that Google loves.
chosen on the basis <strong>of</strong> the linearity <strong>of</strong> the observed curves. Once this selection has been<br />
per<strong>for</strong>med, the routine attempts to fit the background to the <strong>for</strong>eground by assuming two<br />
possibilities:<br />
(1) The background is first adjusted to fit the <strong>for</strong>eground by assuming a simple magnitude<br />
shift. The shift is estimated from the separation between the two curves and by using the<br />
minimum magnitude at which the curve departs from a linear fit by more than one<br />
standard deviation.<br />
(2) The background, Mback, is matched to the <strong>for</strong>eground, M<strong>for</strong>e, by assuming a linear<br />
magnitude trans<strong>for</strong>mation (stretch or compression <strong>of</strong> magnitude scale) <strong>of</strong> the type<br />
(Zuniga and Wyss, 1995):<br />
M<strong>for</strong>e = c * Mback + dM<br />
where c and dM are constants.<br />
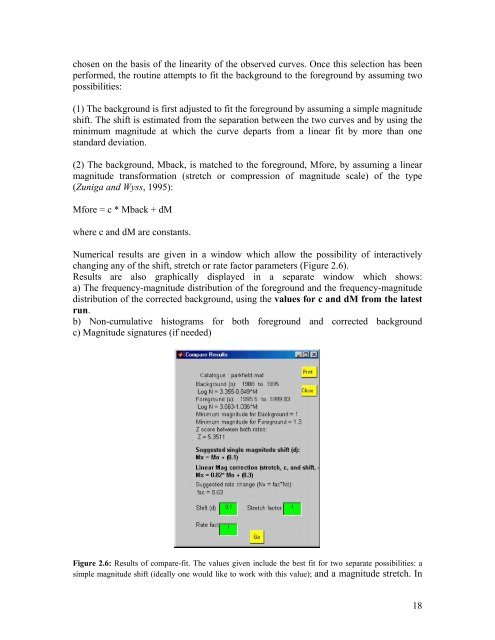
Numerical results are given in a window which allow the possibility <strong>of</strong> interactively<br />
changing any <strong>of</strong> the shift, stretch or rate factor parameters (Figure 2.6).<br />
Results are also graphically displayed in a separate window which shows:<br />
a) The frequency-magnitude distribution <strong>of</strong> the <strong>for</strong>eground and the frequency-magnitude<br />
distribution <strong>of</strong> the corrected background, using the values <strong>for</strong> c and dM from the latest<br />
run.<br />
b) Non-cumulative histograms <strong>for</strong> both <strong>for</strong>eground and corrected background<br />
c) Magnitude signatures (if needed)<br />
Figure 2.6: Results <strong>of</strong> compare-fit. The values given include the best fit <strong>for</strong> two separate possibilities: a<br />
simple magnitude shift (ideally one would like to work with this value); and a magnitude stretch. In<br />
18