zmap a tool for analyses of seismicity patterns typical applications ...
zmap a tool for analyses of seismicity patterns typical applications ...
zmap a tool for analyses of seismicity patterns typical applications ...

You also want an ePaper? Increase the reach of your titles
YUMPU automatically turns print PDFs into web optimized ePapers that Google loves.
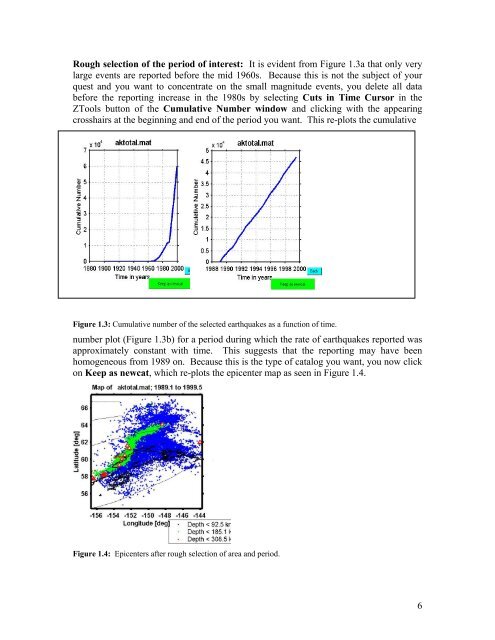
Rough selection <strong>of</strong> the period <strong>of</strong> interest: It is evident from Figure 1.3a that only very<br />
large events are reported be<strong>for</strong>e the mid 1960s. Because this is not the subject <strong>of</strong> your<br />
quest and you want to concentrate on the small magnitude events, you delete all data<br />
be<strong>for</strong>e the reporting increase in the 1980s by selecting Cuts in Time Cursor in the<br />
ZTools button <strong>of</strong> the Cumulative Number window and clicking with the appearing<br />
crosshairs at the beginning and end <strong>of</strong> the period you want. This re-plots the cumulative<br />
Figure 1.3: Cumulative number <strong>of</strong> the selected earthquakes as a function <strong>of</strong> time.<br />
number plot (Figure 1.3b) <strong>for</strong> a period during which the rate <strong>of</strong> earthquakes reported was<br />
approximately constant with time. This suggests that the reporting may have been<br />
homogeneous from 1989 on. Because this is the type <strong>of</strong> catalog you want, you now click<br />
on Keep as newcat, which re-plots the epicenter map as seen in Figure 1.4.<br />
Figure 1.4: Epicenters after rough selection <strong>of</strong> area and period.<br />
6