ISIS 2D Quick Start Guide - Halcrow
ISIS 2D Quick Start Guide - Halcrow
ISIS 2D Quick Start Guide - Halcrow

You also want an ePaper? Increase the reach of your titles
YUMPU automatically turns print PDFs into web optimized ePapers that Google loves.
<strong>ISIS</strong> <strong>2D</strong> <strong>Quick</strong> <strong>Start</strong> <strong>Guide</strong><br />
Figure 5. A screenshot of <strong>ISIS</strong> Mapper window showing the menu item "Trace Cross Section" needed<br />
for viewing a cross section plot in <strong>ISIS</strong> Mapper.<br />
You will see Select Shapefile window offering you to select any of the shapefiles currently loaded in<br />
the TOC. After the cross section file has been specified you will see the Cross Section Plot window in<br />
which you need to specify the <strong>ISIS</strong> <strong>2D</strong> results variable for plotting. As a result, a graph diagram as<br />
shown on Figure 6 should be on your screen.<br />
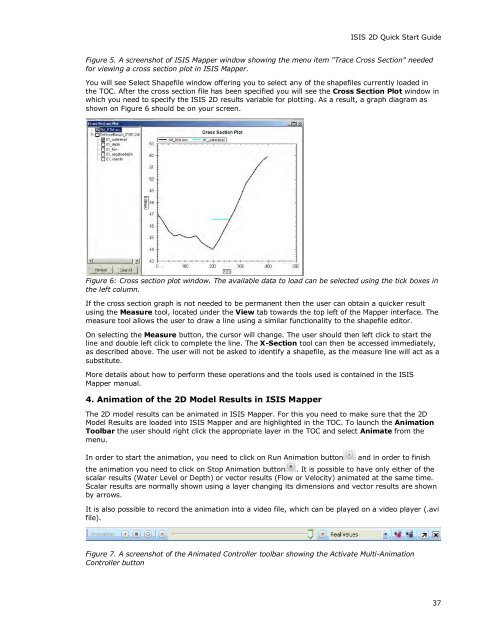
Figure 6: Cross section plot window. The available data to load can be selected using the tick boxes in<br />
the left column.<br />
If the cross section graph is not needed to be permanent then the user can obtain a quicker result<br />
using the Measure tool, located under the View tab towards the top left of the Mapper interface. The<br />
measure tool allows the user to draw a line using a similar functionality to the shapefile editor.<br />
On selecting the Measure button, the cursor will change. The user should then left click to start the<br />
line and double left click to complete the line. The X-Section tool can then be accessed immediately,<br />
as described above. The user will not be asked to identify a shapefile, as the measure line will act as a<br />
substitute.<br />
More details about how to perform these operations and the tools used is contained in the <strong>ISIS</strong><br />
Mapper manual.<br />
4. Animation of the <strong>2D</strong> Model Results in <strong>ISIS</strong> Mapper<br />
The <strong>2D</strong> model results can be animated in <strong>ISIS</strong> Mapper. For this you need to make sure that the <strong>2D</strong><br />
Model Results are loaded into <strong>ISIS</strong> Mapper and are highlighted in the TOC. To launch the Animation<br />
Toolbar the user should right click the appropriate layer in the TOC and select Animate from the<br />
menu.<br />
In order to start the animation, you need to click on Run Animation button and in order to finish<br />
the animation you need to click on Stop Animation button . It is possible to have only either of the<br />
scalar results (Water Level or Depth) or vector results (Flow or Velocity) animated at the same time.<br />
Scalar results are normally shown using a layer changing its dimensions and vector results are shown<br />
by arrows.<br />
It is also possible to record the animation into a video file, which can be played on a video player (.avi<br />
file).<br />
Figure 7. A screenshot of the Animated Controller toolbar showing the Activate Multi-Animation<br />
Controller button<br />
37