Dutch Disease, Resource Curse and Development*
Dutch Disease, Resource Curse and Development*
Dutch Disease, Resource Curse and Development*

You also want an ePaper? Increase the reach of your titles
YUMPU automatically turns print PDFs into web optimized ePapers that Google loves.
*based on Teaching Material on “<strong>Dutch</strong> <strong>Disease</strong>, <strong>Resource</strong> <strong>Curse</strong> <strong>and</strong><br />
Development”, UNCTAD, Virtual Institute, Geneva 2011<br />
<strong>Dutch</strong> <strong>Disease</strong>, <strong>Resource</strong> <strong>Curse</strong><br />
<strong>and</strong> <strong>Development*</strong><br />
Jan Priewe, professor of economics at HTW Berlin – University of<br />
Applied Sciences
Outline<br />
1) Introduction<br />
2) What are the Issues<br />
3) St<strong>and</strong>ard Theories<br />
4) Debates on St<strong>and</strong>ard Theories<br />
5) Empirical Evidence for DD <strong>and</strong> RC<br />
6) Coping with DD <strong>and</strong> RC : Policy Strategies<br />
7) Conclusions<br />
UNCTAD Division on Technology <strong>and</strong> Logistics - Knowledge Sharing, Training <strong>and</strong> Capacity Development Branch<br />
2
1. Introduction<br />
• <strong>Dutch</strong> <strong>Disease</strong> (DD): discovery of new natural<br />
resources or a price boom leads to real appreciation<br />
of the currency <strong>and</strong> hampers growth of<br />
manufacturing or other tradable sectors<br />
• <strong>Resource</strong> <strong>Curse</strong> (RC): long-lasting negative effect<br />
stemming from DD <strong>and</strong> its negative consequences:<br />
technical progress is subdued -> negative<br />
consequences on manufacturing<br />
• ample empirical evidence: most resource-rich<br />
countries grew less than resource-poor countries,<br />
over the long run; but great diversity between<br />
countries; few positive models<br />
• Institutions/governance/policies: can “strong”<br />
institutions <strong>and</strong> “good governance” or prudent<br />
UNCTAD Division on Technology <strong>and</strong> Logistics - Knowledge Sharing, Training <strong>and</strong> Capacity Development Branch<br />
3
2. What are the Issues<br />
• the “Economist” (26 November, 1977: 82-83) first coined<br />
the natural gas boom in the Netherl<strong>and</strong>s in the 1970s as<br />
a “<strong>Dutch</strong> <strong>Disease</strong>”<br />
• This boom had caused a real appreciation which<br />
dampened manufactured exports <strong>and</strong> GDP growth. The<br />
new boom sector crowded out export-oriented industries.<br />
• Adam Smith (<strong>and</strong> others) had suspected that rentier<br />
economies, based on mineral resources rather than manmade<br />
goods cannot generate the wealth that capitalist<br />
nations are capable to produce<br />
• Many of the oil-rich countries experienced unambiguously<br />
less growth over many decades, despite occasionally<br />
mushrooming oil prices, than other developing or OECD<br />
countries.<br />
• DD in the long run: natural resource curse (RC) rather<br />
than a blessing, since technical progress, linked to<br />
UNCTAD Division on Technology <strong>and</strong> Logistics - Knowledge Sharing, Training <strong>and</strong> Capacity Development Branch<br />
4
Focus on Institutions <strong>and</strong> “Good<br />
Governance”<br />
• Botswana, Norway <strong>and</strong> Indonesia are often<br />
considered as positive models, but a closer look<br />
shows that hey are rather special cases<br />
• empirical evidence pro or contra seems to be<br />
enigmatic<br />
• recently the initial focus on exchange rates was<br />
widened or even replaced towards “good<br />
governance” <strong>and</strong> “policies”<br />
• recently many natural resources have been<br />
discovered mainly in Africa <strong>and</strong> Latin America<br />
• if it were mainly a matter of institution building <strong>and</strong><br />
application of proper policies, Africa might face a<br />
bright future <strong>and</strong> it is high time to discover blueprints 5<br />
UNCTAD Division on Technology <strong>and</strong> Logistics - Knowledge Sharing, Training <strong>and</strong> Capacity Development Branch
3. STANDARD THEORIES<br />
UNCTAD Division on Technology <strong>and</strong> Logistics - Knowledge Sharing, Training <strong>and</strong> Capacity Development Branch<br />
6
<strong>Dutch</strong> <strong>Disease</strong>: The St<strong>and</strong>ard Model I<br />
• static model of <strong>Dutch</strong> <strong>Disease</strong> by Corden/Neary (1982)<br />
• Three representative commodities: traditional<br />
tradables, especially manufactured goods (M), nontradable<br />
sector, primarily services (S), boom sector (E),<br />
e.g. fossil energy; note: agricultural goods are in principle<br />
also tradables<br />
• Assumtpions I: small open economy: the world market<br />
prices for tradables <strong>and</strong> natural resources are given: real<br />
exchange rate = Y S /Y M (Y is output)<br />
• Assumptions II: (1) full employment (2) no spending for<br />
capital accumulation (3) international capital immobility so<br />
that saving of windfalls abroad is excluded (4) hence<br />
capital account <strong>and</strong> current account are in balance (5)<br />
inflation is excluded (only a one-time price increase in<br />
non-tradables) (6) no money (Barter economy) <strong>and</strong> no<br />
nominal exchange rate, hence no monetary <strong>and</strong><br />
exchange rate policy (7) no interest rate (8) no<br />
UNCTAD Division on Technology <strong>and</strong> Logistics - Knowledge Sharing, Training <strong>and</strong> Capacity Development Branch<br />
7
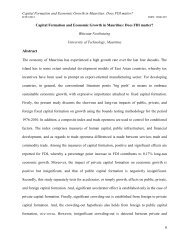
<strong>Dutch</strong> <strong>Disease</strong>: The St<strong>and</strong>ard Model II<br />
Figure 1: Effect of the boom on the<br />
labour market<br />
Source: Corden/Neary<br />
(1982: 828).<br />
Before the boom: total labour<br />
supply O s -O t ; wage is w 0 ;<br />
L T <strong>and</strong> L S are labour<br />
dem<strong>and</strong> for tradables <strong>and</strong><br />
non-tradables; equilibrium<br />
in A<br />
Effects of resource boom:<br />
1) resource movement effect:<br />
• direct deindustrialisation A<br />
→ B<br />
• labour dem<strong>and</strong> in the boom<br />
sector crowds out<br />
employment in other<br />
sectors; L T shifts to L‟ T<br />
2) spending effect B → G<br />
Indirect deindustrialisation:<br />
• more revenue → additional<br />
8<br />
spending <strong>and</strong> labour<br />
UNCTAD Division on Technology <strong>and</strong> Logistics - Knowledge Sharing, Training <strong>and</strong> Capacity Development Branch
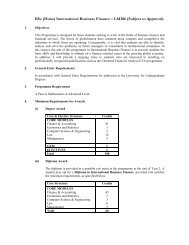
<strong>Dutch</strong> <strong>Disease</strong>: The St<strong>and</strong>ard Model III<br />
Figure 2: Effects of the boom on<br />
the commodity market<br />
Source: Corden/Neary (1982:<br />
829)<br />
Fig. 2 shows a productionpossibility-frontier-curve:<br />
• initially, before the boom, curve<br />
T-S. The highest indifference<br />
curve can be reached at a. The<br />
tangent at a is the real<br />
exchange rate.<br />
• The resource boom shifts the<br />
curve to T„-S.<br />
• If there were no exchange rate<br />
change, b would be the new<br />
equilibrium.<br />
• But following the traditional<br />
consumption pattern O-n, point<br />
c would be reached, i.e. much<br />
more spending for S.<br />
9<br />
• Since non-tradables have<br />
UNCTAD Division on Technology <strong>and</strong> Logistics - Knowledge Sharing, Training <strong>and</strong> Capacity Development Branch
<strong>Dutch</strong> <strong>Disease</strong>: The St<strong>and</strong>ard Model IV<br />
• St<strong>and</strong>ard Model does not assert that resource boom<br />
makes country poor – but real appreciation occurs <br />
more imports of tradables crowding out of<br />
domestic tradables (manfactures <strong>and</strong>/or agricultural<br />
goods) enhanced production of non-tradables<br />
• Does not look at resource price drops or exhaustion<br />
of resources<br />
• If resource movement effect is small (extraction of<br />
natural resources is capital intensive), spending<br />
effect predominates<br />
UNCTAD Division on Technology <strong>and</strong> Logistics - Knowledge Sharing, Training <strong>and</strong> Capacity Development Branch<br />
10
<strong>Resource</strong> <strong>Curse</strong> I<br />
• Sachs/Warner (1995) : empirical research, <strong>and</strong><br />
drawing on endogenous growth theory<br />
• evidence from cross country studies shows that<br />
natural resource-rich countries have experienced<br />
less long-term growth rates than resource poor<br />
countries<br />
• the price level in “rentier economies” (big share of<br />
income are resource rents) is in general higher than<br />
in resource poor economies<br />
• resource-rich countries suffered from lower growth of<br />
manufacture exports<br />
• Manufacturing is main carrier of technical progress<br />
(human capital, R & D) 11<br />
UNCTAD Division on Technology <strong>and</strong> Logistics - Knowledge Sharing, Training <strong>and</strong> Capacity Development Branch
<strong>Resource</strong> <strong>Curse</strong> II<br />
• higher domestic prices lead to reduced<br />
competitiveness of manufacturing<br />
• Engines for growth: Learning-by-doing effects, spilling<br />
over to other firms <strong>and</strong> industries, <strong>and</strong> increasing<br />
returns to scale<br />
• even if DD effect is only temporary, temporarily<br />
reduced knowledge accumulation can have a lasting<br />
effect (path dependence). From this angle, it is<br />
predominantly reduced human capital accumulation<br />
that hampers industrialization, continuous upgrading<br />
<strong>and</strong> diversification of industries.<br />
• high volatility of mineral <strong>and</strong> energy commodities <strong>and</strong><br />
related uncertainties, 12<br />
UNCTAD Division on Technology <strong>and</strong> Logistics - Knowledge Sharing, Training <strong>and</strong> Capacity Development Branch
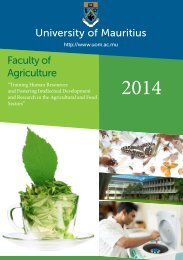
<strong>Resource</strong> <strong>Curse</strong> III<br />
Figure 3: Growth <strong>and</strong> natural resource abundance 1970-1989<br />
UNCTAD Division on Technology <strong>and</strong> Logistics - Knowledge Sharing, Training <strong>and</strong> Capacity Development Branch<br />
13
<strong>Resource</strong> <strong>Curse</strong> IV<br />
Figure 4: Natural resource dependence <strong>and</strong> exports of manufactures (1970-89)<br />
UNCTAD Division on Technology <strong>and</strong> Logistics - Knowledge Sharing, Training <strong>and</strong> Capacity Development Branch<br />
14
4. DEBATES ON STANDARD<br />
THEORIES: LIMITATIONS,<br />
SHORTCOMINGS, CRITICISMS<br />
UNCTAD Division on Technology <strong>and</strong> Logistics - Knowledge Sharing, Training <strong>and</strong> Capacity Development Branch<br />
15
Limitations, Shortcomings, Criticisms: DD<br />
• Although st<strong>and</strong>ard model captures correctly the key problem<br />
of resource booms, it suffers from too strong assumptions<br />
which obfuscate reality<br />
• To use the model for empirical analysis, money <strong>and</strong><br />
currencies must be included<br />
• Transposing the basic features of the model from a barter<br />
economy to a monetary economy opens the perspective to<br />
mitigate or cure the disease with macroeconomic, especially<br />
exchange rate policy<br />
• Inflation, monetary <strong>and</strong> exchange rate policy should be<br />
included<br />
• … <strong>and</strong> also international capital mobility incl. saving the<br />
windfalls abroad<br />
• DD <strong>and</strong> RC can be understood in a Ricardian perspective:<br />
natural resources become new comparative advantage that<br />
crowds out other traditional sectors<br />
UNCTAD Division on Technology <strong>and</strong> Logistics - Knowledge Sharing, Training <strong>and</strong> Capacity Development Branch<br />
16
Limitations, Shortcomings, Criticisms: RC<br />
• Windfall boom phases can increase the wealth of<br />
resource-rich countries considerably – booms don‟t look<br />
like disease or a curse … but development of<br />
employment <strong>and</strong> man-made wealth outside the boom<br />
sector is indeed hindered<br />
• Strong inflation due to spending effect is biggest risk<br />
which is not reflected in st<strong>and</strong>ard model<br />
• Other deficiency of the model: income distribution not<br />
addressed; rentier economies are mostly not “normal”<br />
market economies – strong financial role of state which<br />
receives big parts of the rents<br />
• The long-run disease is difficult to diagnose with regard<br />
to the initial causes <strong>and</strong> the subsequent additional<br />
causes that eventually lead to vicious circles which<br />
corroborate the disease.<br />
• Governments <strong>and</strong> central banks often try to mitigate too<br />
strong appreciations or depreciations - the more<br />
successful the attenuation is, the less visible is the<br />
UNCTAD Division on Technology <strong>and</strong> Logistics - Knowledge Sharing, Training <strong>and</strong> Capacity Development Branch<br />
17
5. EMPIRICAL EVIDENCE FOR DD<br />
AND RC<br />
UNCTAD Division on Technology <strong>and</strong> Logistics - Knowledge Sharing, Training <strong>and</strong> Capacity Development Branch<br />
18
Empirical Evidence for DD <strong>and</strong> RC I<br />
Figure 5: Crude oil prices 1970-2009<br />
Source : http ://www.wtrg.com/oil_graphs/oilprice1947.gif<br />
UNCTAD Division on Technology <strong>and</strong> Logistics - Knowledge Sharing, Training <strong>and</strong> Capacity Development Branch<br />
19
index metals & minerals, 1970=100<br />
US$/barrel, crude oil (Brent)<br />
Empirical Evidence for DD <strong>and</strong> RC II<br />
Figure 6: Prices of mineral commodities <strong>and</strong> crude oil<br />
Prices of mineral commodities* (index, 1970=100) <strong>and</strong> crude oil<br />
(US$/barrel), 1982-2010<br />
800<br />
700<br />
160<br />
140<br />
600<br />
120<br />
500<br />
100<br />
400<br />
80<br />
300<br />
60<br />
200<br />
40<br />
100<br />
20<br />
0<br />
0<br />
Q2 1982<br />
Q4 1983<br />
Q2 1985<br />
Q4 1986<br />
Q2 1988<br />
Q4 1989<br />
Q2 1991<br />
Q4 1992<br />
Q2 1994<br />
Q4 1995<br />
Q2 1997<br />
Q4 1998<br />
Q2 2000<br />
Q4 2001<br />
Q2 2003<br />
Q4 2004<br />
Q2 2006<br />
Q4 2007<br />
Q2 2009<br />
index metals & minerals, lhs<br />
crude oil, brent, US$/barrel, rhs<br />
*Gold, silver, aluminum, zinc, copper, potash, lead, iron<br />
Source: Datastream, own calculations<br />
20<br />
UNCTAD Division on Technology <strong>and</strong> Logistics - Knowledge Sharing, Training <strong>and</strong> Capacity Development Branch
Empirical evidence III<br />
• Oil boom in the 1970s was followed by a long slump<br />
until end of 1990s, but often appreciation of REER was<br />
not offset by subsequent depreciation<br />
• In some countries spending windfalls led to high<br />
inflation which triggered depreciation of the exchange<br />
rate<br />
• During the oil boom 1998-2007 most countries<br />
experienced real appreciation - or avoided this through<br />
saving windfalls abroad (central bank reserves,<br />
sovereign wealth funds etc.)<br />
• In contrast to st<strong>and</strong>ard model, model countries built up<br />
big current account surpluses during booms mirror<br />
image of saving windfalls abroad<br />
• Low long-term growth in oil-rich countries, but wealth<br />
21<br />
accumulation abroad in several countries<br />
UNCTAD Division on Technology <strong>and</strong> Logistics - Knowledge Sharing, Training <strong>and</strong> Capacity Development Branch
Empirical Evidence for DD <strong>and</strong> RC IV<br />
Algeria 1960-2010 1.10 1998-2010 1.99<br />
Table 1:<br />
GDP growth<br />
rate per<br />
capita p.a. in<br />
OPEC<br />
countries,<br />
per cent<br />
Angola 1985-2010 2.29 1998-2010 6.59<br />
Ecuador 1960-2010 0.70 1998-2010 2.29<br />
Iran, Islamic Rep. (1965-2009) 1965-2009 0.88 1998-2009 3.23<br />
Iraq 1997-2010 0.32 1998-2010 -1.87<br />
Libya 1999-2009 2.11 1999-2009 2.11<br />
Kuwait 1995-2007 1.60 1998-2008 2.45<br />
Nigeria 1960-2010 1.29 1998-2010 3.38<br />
Qatar 2000-2009 3.27 2000-2009 3.27<br />
Saudi Arabia 1968-2009 0.84 1998-2009 0.64<br />
United Arab Emirates 1973-2009 -1.80 1998-2009 1.24<br />
Venezuela, RB 1960-2010 0.00 1998-2010 0.49<br />
OPEC average* 1.05 2.15<br />
OECD-countries 1970-2010 2.01 1998-2010 1.24<br />
sub-Sahara Africa (developing only) 1960-2010 0.76 1998-2010 1.82<br />
South Asia 1960-2010 3.20 1998-2010 5.19<br />
Least developed countries 1981-2010 1.48 1998-2010 3.43<br />
Latin America & Caribbean (developing only) 1960-2010 1.71 1998-2010 1.84<br />
East Asia & Pacific (developing only) 1960-2010 5.52 1998-2010 7.81<br />
*per annum in the periods indicated<br />
Source: World Bank, WDI, own calculations<br />
UNCTAD Division on Technology <strong>and</strong> Logistics - Knowledge Sharing, Training <strong>and</strong> Capacity Development Branch<br />
22
% of GDP<br />
Empirical Evidence for DD <strong>and</strong> RC V<br />
Figure 7: Total Natural <strong>Resource</strong> Rents<br />
Total natural resource rents* in % of GDP<br />
Algeria<br />
120<br />
Angola<br />
100<br />
peak of average<br />
resource rent of 19<br />
countries 2005: 48%<br />
Iraq<br />
Azerbaijan<br />
Bolivia<br />
Ecuador<br />
80<br />
Iraq<br />
Kuwait<br />
60<br />
40<br />
Angola<br />
Nigeria<br />
Libya<br />
Norway<br />
Russian Federation<br />
Saudi Arabia<br />
United Arab Emirates<br />
20<br />
Venezuela, RB<br />
Indonesia<br />
0<br />
1990 1991 1992 1993 1994 1995 1996 1997 1998 1999 2000 2001 2002 2003 2004 2005 2006 2007 2008<br />
Source: WB, WDI 2011<br />
Norway<br />
*sum of oil rents, natural gas rents, coal rents (hard <strong>and</strong> soft), mineral rents, <strong>and</strong> forest rents<br />
Mexico<br />
Nigeria<br />
OECD members<br />
UNCTAD Division on Technology <strong>and</strong> Logistics - Knowledge Sharing, Training <strong>and</strong> Capacity Development Branch<br />
23
% of GDP<br />
Empirical Evidence for DD <strong>and</strong> RC VI<br />
Figure 8: Manufacturing, value added, % of GDP<br />
Manufacturing, value added, % of GDP<br />
Angola<br />
35<br />
Algeria<br />
Venezuela, RB<br />
30<br />
Indonesia<br />
Ecuador<br />
Russian Federation<br />
25<br />
average China,<br />
India, Brazil<br />
Azerbaijan<br />
Saudi Arabia<br />
20<br />
Venezuela<br />
Russian Federation<br />
Kuwait<br />
15<br />
Libya<br />
Bolivia<br />
10<br />
Norway<br />
Iraq<br />
5<br />
0<br />
1990<br />
1991<br />
1992<br />
1993<br />
1994<br />
1995<br />
1996<br />
1997<br />
1998<br />
1999<br />
Iraq<br />
2000<br />
2001<br />
2002<br />
2003<br />
2004<br />
Nigeria<br />
2005<br />
2006<br />
2007<br />
2008<br />
2009<br />
Angola<br />
Source: World Bank, World Development Indicators, own calculations<br />
UNCTAD Division on Technology <strong>and</strong> Logistics - Knowledge Sharing, Training <strong>and</strong> Capacity Development Branch<br />
Norway<br />
Indonesia<br />
United Arab Emirates<br />
Nigeria<br />
Manufacturing, value added<br />
(% of GDP) average China,<br />
Brazil, India; SA<br />
Reihe8<br />
24
Nigeria, Iran, Algeria, Sambia, Saudi-Arabia<br />
Empirical Evidence for DD <strong>and</strong> RC VII<br />
Fig. 9: Real effective exchange rates<br />
Real effective exchange rates (index 2005 = 100)<br />
700<br />
200<br />
Algeria (lhs)<br />
600<br />
Nigeria (lhs)<br />
Venezuela<br />
180<br />
Iran (lhs)<br />
Iran (lhs)<br />
160<br />
Nigeria (lhs)<br />
500<br />
140<br />
Saudi Arabia (rhs)<br />
400<br />
Norway<br />
120<br />
100<br />
Zambia (lhs)<br />
Chile (rhs)<br />
300<br />
200<br />
100<br />
0<br />
1980<br />
1981<br />
1982<br />
Saudi-Arabia<br />
Zambia<br />
1983<br />
1984<br />
1985<br />
1986<br />
1987<br />
1988<br />
1989<br />
Algeria<br />
(lhs)<br />
Russian<br />
Federation<br />
1990<br />
1991<br />
1992<br />
1993<br />
1994<br />
1995<br />
1996<br />
1997<br />
1998<br />
1999<br />
2000<br />
2001<br />
2002<br />
2003<br />
2004<br />
2005<br />
2006<br />
2007<br />
2008<br />
2009<br />
UNCTAD Division on Technology <strong>and</strong> Logistics - Knowledge Sharing, Training <strong>and</strong> Capacity Development Branch<br />
80<br />
60<br />
40<br />
20<br />
0<br />
Ecuador (rhs)<br />
Norway (rhs)<br />
South Africa (rhs)<br />
Venezuela (rhs)<br />
Russian Federation<br />
(rhs)<br />
25
Empirical Evidence for DD <strong>and</strong> RC VIII<br />
• The magnitude of the resource rent, as calculated by the World Bank,<br />
was in 2005 on average 48 per cent of GDP<br />
• most OPEC countries have remained mono exporters of oil <strong>and</strong>/or gas<br />
• Contrary to st<strong>and</strong>ard DD theory, in the period between 1970 <strong>and</strong> 2009<br />
growth of manufacturing output was quite diverse, but often starting<br />
from a very low level<br />
• There is a broad spectrum of manufacturing (value added) as a share<br />
of GDP, in general much lower than in emerging economies<br />
• The majority of 17 energy-rich countries analysed achieved fairly low<br />
inflation over the 50 years, but some fell in high or even hyperinflation<br />
• In boom periods, there is a trend to real appreciation, but in some<br />
countries the exchange rate is pegged to the US-$ (e.g. several Middle<br />
East countries)<br />
• 1n the 1980s <strong>and</strong> until 1999, many commodity exporters incurred high<br />
external debt using resources as collateral to weather the oil slump,<br />
<strong>and</strong> often fell in over-indebtedness 26<br />
UNCTAD Division on Technology <strong>and</strong> Logistics - Knowledge Sharing, Training <strong>and</strong> Capacity Development Branch
Empirical evidence IX: External Saving<br />
• Gelb & Associates (1988) analyzed the first two oil price booms of<br />
the 1970s for a sample of six developing countries<br />
• They concluded that with hindsight the governments should have<br />
saved more abroad <strong>and</strong> spent less at home recycling of petrodollars<br />
via capital markets<br />
• During the recent oil <strong>and</strong> commodity boom this policy had been<br />
implemented to a higher degree than formerly<br />
• Saving abroad is difficult for poor resource-rich <strong>and</strong> populous<br />
countries (e.g. Angola, Nigeria) – they desire more consumption<br />
<strong>and</strong> investment immediately<br />
• Especially in most OPEC countries <strong>and</strong> in Norway, external saving<br />
<strong>and</strong> active exchange rate management were cornerstones of oil<br />
management.<br />
• In contrast, Angola, Venezuela <strong>and</strong>, to a lesser extent, Nigeria<br />
opted for the spending strategy, often with inflationary results<br />
• Norway, often seen as a model, invests oil/gas windfalls abroad as<br />
a pension fund <strong>and</strong> uses only the returns domestically, besides<br />
UNCTAD Division on Technology <strong>and</strong> Logistics - Knowledge Sharing, Training <strong>and</strong> Capacity Development Branch<br />
27
Indonesia – Successfully Escaping <strong>Dutch</strong><br />
<strong>Disease</strong> <strong>and</strong> <strong>Resource</strong> <strong>Curse</strong><br />
• The economy managed to grow quickly <strong>and</strong> achieved a<br />
thorough diversification of its economy towards robust <strong>and</strong><br />
diversified industrialization<br />
• It seems that the early exhaustion of oil reserves triggered<br />
diversification of the economy (peak in 1977), but gas extraction<br />
was partly a substitute<br />
• Windfalls crowded out agricultural employment, not<br />
manufacturing, triggering strong productivity increases in<br />
agriculture<br />
• Overall, Indonesia managed to avoid debt-led industrialisation<br />
with windfall inflows that were – despite high corruption –<br />
successfully used for the modernisation of agriculture <strong>and</strong> for<br />
fostering manufacturing, while keeping the real exchange rate in<br />
the long run fairly stable, despite longer periods of overvaluation<br />
• Perhaps it is better to have some natural resources, but not too<br />
UNCTAD Division on Technology <strong>and</strong> Logistics - Knowledge Sharing, Training <strong>and</strong> Capacity Development Branch<br />
28
Nigeria – <strong>Dutch</strong> disease, <strong>Resource</strong> <strong>Curse</strong><br />
<strong>and</strong> Poor Institutions<br />
• All characteristics of DD <strong>and</strong> RC can be seen in Nigeria at an<br />
extreme extent<br />
• Nigeria is <strong>and</strong> has been since the 1960s heavily oil-dependent<br />
• Manufacturing is still almost negligible<br />
• Use of windfalls for predominantly unproductive public investment<br />
• real exchange rate roller-coaster, severe inflation could not be<br />
avoided<br />
• The oil slumps after the booms in the 1970s were countered with<br />
heavy external borrowing (up to 193 per cent of GDP in 1993)<br />
• Absolute poverty increased from 1970 to 2000 from 36 to 70 per<br />
cent of the population.<br />
• Some authors blame “bad institutions” <strong>and</strong> corruption as the main<br />
cause of the Nigerian malaise<br />
• Note: a rentier economy with high profits from oil <strong>and</strong> gas windfalls,<br />
gives the government enormous power; this transforms the 29<br />
UNCTAD Division on Technology <strong>and</strong> Logistics - Knowledge Sharing, Training <strong>and</strong> Capacity Development Branch
Venezuela – no growth despite oilabundance<br />
Figure 10: Venezuela: GDP per capita 1980-2010<br />
Source: World Bank 2011, World Development Indicators, own calculations<br />
30<br />
UNCTAD Division on Technology <strong>and</strong> Logistics - Knowledge Sharing, Training <strong>and</strong> Capacity Development Branch
Venezuela – no growth despite oilabundance<br />
• Fairly high income p.c. level in Venezuela since long<br />
in PPP, but hardly any trend growth since 1980<br />
• Strong increase of average incomes in current US-$,<br />
but this view is deceptive: real incomes hardly rose<br />
• Nominal exchange rate is controlled, but inflation is<br />
not real appreciation<br />
• Spending effect dominates: much of windfalls is<br />
spent locally for consumption, in recent years in a<br />
pro-poor manner; Gini coefficient fell<br />
• Industrial sector is kept alive, often highly subsidized<br />
<strong>and</strong> inefficient<br />
• Venezuela suffers both DD <strong>and</strong> RC<br />
UNCTAD Division on Technology <strong>and</strong> Logistics - Knowledge Sharing, Training <strong>and</strong> Capacity Development Branch<br />
31
Botswana – a very special case<br />
Botswana – a success model:<br />
• Botswana (only 2 Mio. inhabitants) benefits from wealth<br />
in diamonds remarkable continuous GDP growth with<br />
fairly low inflation<br />
• Economy strongly dependent on diamonds exports<br />
• In contrast to oil – steady increase of world market<br />
diamonds prices since five decades permanent boom<br />
• Very little diversification of industry – manufacturing<br />
neglegible, but strong civil service <strong>and</strong> parastatal sector<br />
• Increasing inequality of income distribution<br />
• Real exchange rate strongly managed by central bank<br />
UNCTAD Division on Technology <strong>and</strong> Logistics - Knowledge Sharing, Training <strong>and</strong> Capacity Development Branch<br />
32
US$, p.c.<br />
index, 2005 = 100<br />
Norway – another special case<br />
100.000<br />
90.000<br />
80.000<br />
70.000<br />
60.000<br />
50.000<br />
40.000<br />
30.000<br />
20.000<br />
10.000<br />
0<br />
1970<br />
1972<br />
REER<br />
(downward =<br />
appreciation),<br />
rhs<br />
GDP p.c., constant US$,<br />
lhs<br />
Source: World Bank 2011, World<br />
Development Indicators, own calculations<br />
Norway: key indicators<br />
GDP p.c., PPP in<br />
constant US$, lhs<br />
1974<br />
1976<br />
1978<br />
1980<br />
1982<br />
1984<br />
1986<br />
1988<br />
1990<br />
1992<br />
nominal<br />
exchange rate<br />
(downward =<br />
appreciation),<br />
rhs<br />
GDP p.c., current US$, lhs<br />
1994<br />
1996<br />
1998<br />
2000<br />
2002<br />
current account<br />
balance, % of GDP,<br />
rhs<br />
2004<br />
2006<br />
2008<br />
33<br />
UNCTAD Division on Technology <strong>and</strong> Logistics - Knowledge Sharing, Training <strong>and</strong> Capacity Development Branch<br />
2010<br />
160<br />
140<br />
120<br />
100<br />
80<br />
60<br />
40<br />
20<br />
0<br />
-20
Norway – another special case<br />
• Oil <strong>and</strong> gas resources discovered in early 1970s, as a<br />
highly developed small country (5 mill. inhabitants)<br />
• Natural resources state-owned<br />
• Windfalls saved in a national fund abroad, used as a<br />
pension fund, amounting to 120 % of GDP<br />
• returns from the capital stock transferred to Norway<br />
• Social security contributions <strong>and</strong> taxes < average<br />
OECD countries indirectly consumption of windfalls<br />
• Low inflation, managed exchange rates<br />
• Low long-term per capita growth<br />
• High domestic prices, wages <strong>and</strong> cost level<br />
• Diversificcation of manufacturing unsuccessful<br />
• Industry centered on construction <strong>and</strong> maritime<br />
industries<br />
• 85,000 US-$ p.c., but in PPP 55,000 US-$ (2009/10)<br />
• Gini-cofficient as low as 0.258<br />
• Similar to Middle East, but equal distribution<br />
UNCTAD Division on Technology <strong>and</strong> Logistics - Knowledge Sharing, Training <strong>and</strong> Capacity Development Branch<br />
34
6. COPING WITH DD AND RC :<br />
SEARCHING FOR POLICY<br />
STRATEGIES<br />
UNCTAD Division on Technology <strong>and</strong> Logistics - Knowledge Sharing, Training <strong>and</strong> Capacity Development Branch<br />
35
Extraction Policy <strong>and</strong> use of resource rents<br />
• How much natural resource should be extracted How to<br />
use windfalls<br />
• Hotelling‘s Rule: extraction is conditional on maximization<br />
of rents - achieved if the long-term interest rate equals the<br />
expected net price increase of the natural resource. In<br />
reality, imperfect competition <strong>and</strong> high uncertainty<br />
predominate. Rule not really applicable under real world<br />
conditions<br />
• Hartwick-Rule stipulates that the loss of exhaustive<br />
natural resources by extraction can only be offset by using<br />
the resource rents for the generation of produced capital.<br />
Only the yields from this produced wealth should be be<br />
consumed. Rule for environmental sustainability<br />
• Neither the Hotelling-Rule nor the Hartwick-Rule deal<br />
directly with DD<br />
• Yet, containing DD is easier if the speed of extraction of 36<br />
UNCTAD Division on Technology <strong>and</strong> Logistics - Knowledge Sharing, Training <strong>and</strong> Capacity Development Branch
Alternative Strategies for <strong>Resource</strong>-rich<br />
Countries<br />
UNCTAD Division on Technology <strong>and</strong> Logistics - Knowledge Sharing, Training <strong>and</strong> Capacity Development Branch<br />
37
What is the best strategy<br />
• Inflationary spending <strong>and</strong> resource movement effects<br />
should be mitigated<br />
• In poor countries use of windfalls for productive investment<br />
advisable - only if non-inflationary<br />
• When windfalls are huge, saving abroad is MUST to avoid<br />
inflation<br />
• Lower current account deficit, repay external debt<br />
• Use of rents for industrial <strong>and</strong> agricultural policy, incl.<br />
productive infrastructure <strong>and</strong> human capital formation<br />
• Monetary policy should target stabilization of REER or<br />
mitigating swings<br />
• Use mainly fiscal policy for keeping price stability<br />
• Save part of windfalls abroad, use for counter-cyclical<br />
policy to bridge slumps<br />
• Mind pro-rich distribution of rents<br />
38<br />
UNCTAD Division on Technology <strong>and</strong> Logistics - Knowledge Sharing, Training <strong>and</strong> Capacity Development Branch
7. CONCLUSION AND OUTLOOK<br />
UNCTAD Division on Technology <strong>and</strong> Logistics - Knowledge Sharing, Training <strong>and</strong> Capacity Development Branch<br />
39
Conclusion <strong>and</strong> Outlook I<br />
• Windfalls tend to trigger real currency appreciation,<br />
depreciations in slumps<br />
• Avoid inflationary use of the windfalls, cope with volatility<br />
of resource prices<br />
• DD can evolve into an enduring RC if the core sector of<br />
technical progress <strong>and</strong> growth, manufacturing, is<br />
continuously suppressed<br />
• The terms “disease” <strong>and</strong> “curse” are a bit misleading, as<br />
wealth increases in booms if not offset in slumps or lost<br />
by inflation or de-industrialization<br />
• Bad “institutions” <strong>and</strong> “bad governance” are not the<br />
cause of DD <strong>and</strong> RC, but they exacerbate the problems<br />
• Among developing countries with strong resource<br />
dependence, the only model for more blessing than<br />
curse was Indonesia but it is a special case 40<br />
UNCTAD Division on Technology <strong>and</strong> Logistics - Knowledge Sharing, Training <strong>and</strong> Capacity Development Branch
Conclusion <strong>and</strong> Outlook II<br />
• There is no quick <strong>and</strong> easy medicine for DD <strong>and</strong> RC<br />
• A new overwhelmingly strong comparative<br />
advantage squeezes more or less the comparatively<br />
disadvantageous sectors<br />
• A mix of saving abroad <strong>and</strong> spending for investment<br />
domestically is advisable, embedded in macro<br />
policies which stabilize the real exchange rate at a<br />
level competitive for non-resource tradables,<br />
especially manufactures<br />
• More generally, resource-rich economies are, more<br />
or less, rentier economies which differ from normal<br />
market economies. DD <strong>and</strong> RC concepts should be<br />
embedded in the political economy of rentier<br />
economies whose predominant income are rents<br />
from natural resources.<br />
UNCTAD Division on Technology <strong>and</strong> Logistics - Knowledge Sharing, Training <strong>and</strong> Capacity Development Branch<br />
41
Literature<br />
• Corden, W.M. <strong>and</strong> Neary, J.P. (1982). “Booming Sector <strong>and</strong> De-<br />
Industrialisation in a Small Open Economy”. The Economic Journal, 92<br />
(December 1982): 825-848.<br />
• As a first quick introduction: Ebrahim-zadeh, Ch., 2003: <strong>Dutch</strong> <strong>Disease</strong>:<br />
Too much wealth managed unwisely. In: Finance & Development, Vol.<br />
40, March, No. 1<br />
https://www.imf.org/external/pubs/ft/f<strong>and</strong>d/2003/03/ebra.htm<br />
• Gelb, A. <strong>and</strong> Associates (1988). Oil Windfalls: Blessing or <strong>Curse</strong><br />
Published for the World Bank. Oxford, Oxford University Press.<br />
• Humphreys, M., Sachs, J. <strong>and</strong> Stiglitz, J.E., Eds. (2007). Escaping the<br />
<strong>Resource</strong> <strong>Curse</strong>. New York, Columbia University Press.<br />
• Sachs, J.D., <strong>and</strong> Warner, A.M. (2001). “The <strong>Curse</strong> of Natural<br />
<strong>Resource</strong>s”. European Economic Review, 45(4-6): 827-838.<br />
• UNCTAD (2008): The Least Developed Countries Report 2009: The<br />
state <strong>and</strong> developing governance. Background Paper No. 4 (April 2008)<br />
by Jourdan, P. (2008): Challenges of LDC <strong>Resource</strong>-Based Development.<br />
Geneva.<br />
UNCTAD Division on Technology <strong>and</strong> Logistics - Knowledge Sharing, Training <strong>and</strong> Capacity Development Branch<br />
42